
Microsoft Cycle From March Low Still In Progress
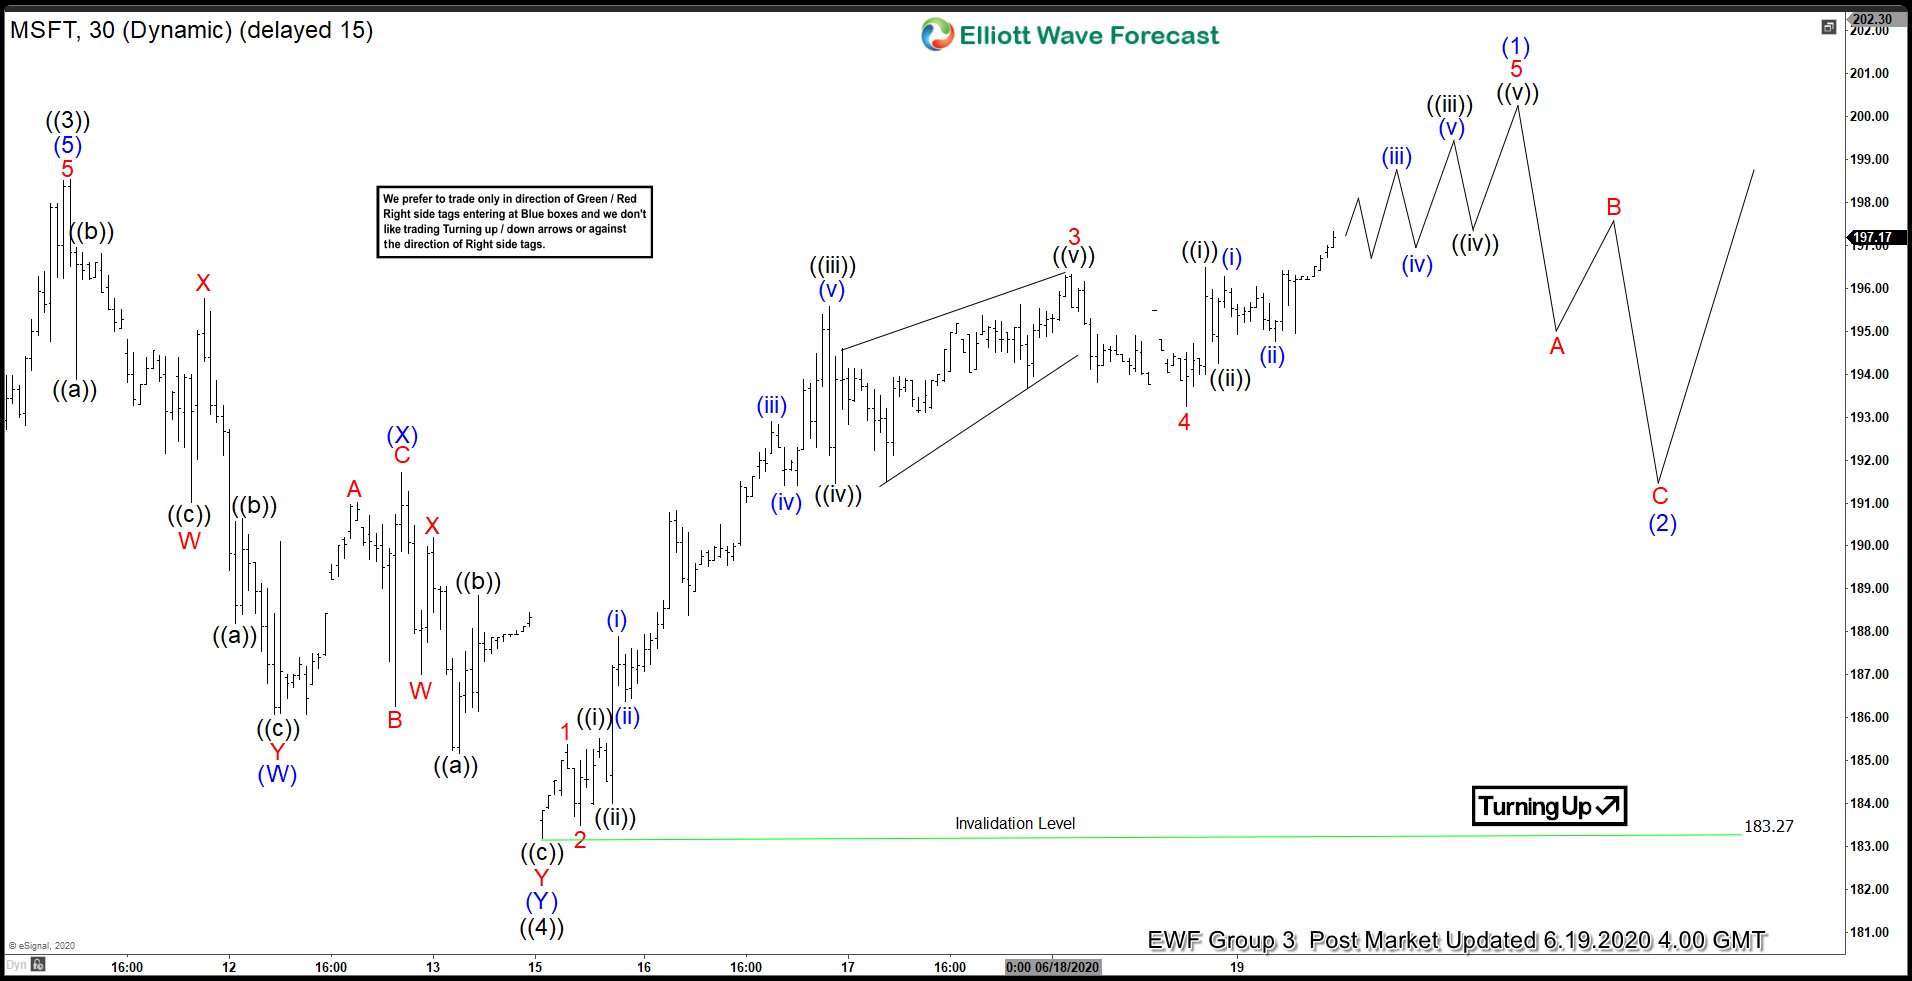
Microsoft Corporation (MSFT) is currently still extending higher from 3.23.2020 low. The stock reached an all-time high on 6.11.2020 and ended wave ((3)) at 198.52 high. From there, MSFT did a pullback in wave ((4)) as a Double Three Elliott Wave structure. Down from 6.11.2020 high, wave (W) ended at 186.07 low. The bounce in wave (X) ended at 191.72 high. The stock then extended lower and ended wave (Y) at 183.27 low. The stock has since extended higher from that low. From 183.27 low, wave 1 of (1) has already ended at 185.39 high. Wave 2 pullback ended at 183.50 low. Afterward, the stock continues to push higher in wave 3. The internal subdivision of wave 3 unfolded as a 5 waves impulse Elliott Wave structure.
Wave ((i)) ended at 185.52 high and wave ((ii)) ended at 184.01 low. From there, wave ((iii)) ended at 195.58 high and wave ((iv)) pullback ended at 191.46 low. The push higher in wave ((v)) ended at 196.32 high. These 5 waves up end wave 3 to a higher degree. This is then followed by a pullback in wave 4, which ended at 193.24 low. Currently, wave 5 rally is in progress. Wave ((i)) has ended at 196.49 high and wave ((ii)) ended at 194.25 low. As far as pivot at 183.27 low stays intact, expect the dips in 3, 7, or 11 swings to find support and MSFT to extend higher to end 5 waves rally from 6.15.2020 low in wave (1) before doing a bigger 3 waves pullback in wave (2) later.
MSFT 30 Minutes Elliott Wave Chart
(Click on image to enlarge)
MSFT Elliott Wave Video
Video Length: 00:04:12
Disclaimer: Futures, options, and over the counter foreign exchange products may involve substantial risk and may not be suitable for all investors. Leverage can work against you as well as for ...
more

