
The following one-year charts and year-to-date percentages gained/lost graph show how much the 10 Technology stocks within the FNGU ETF have dropped during those periods.
META has lost the most, percentage-wise (70.51%), so far this year, followed by:
- NVDA (52.93%),
- NFLX (50.91),
- BIDU (47.21%),
- BABA (46.34%),
- AMZN (37.97%),
- TSLA (35.13%),
- GOOGL (33.53%),
- MSFT (29.41%), and
- AAPL (11.93%).
FNGU has, itself, lost 87.05% this year.
Further weakness in META could drag these stocks lower...one to watch.
(Click on image to enlarge)

One-year Daily Charts
(Click on image to enlarge)
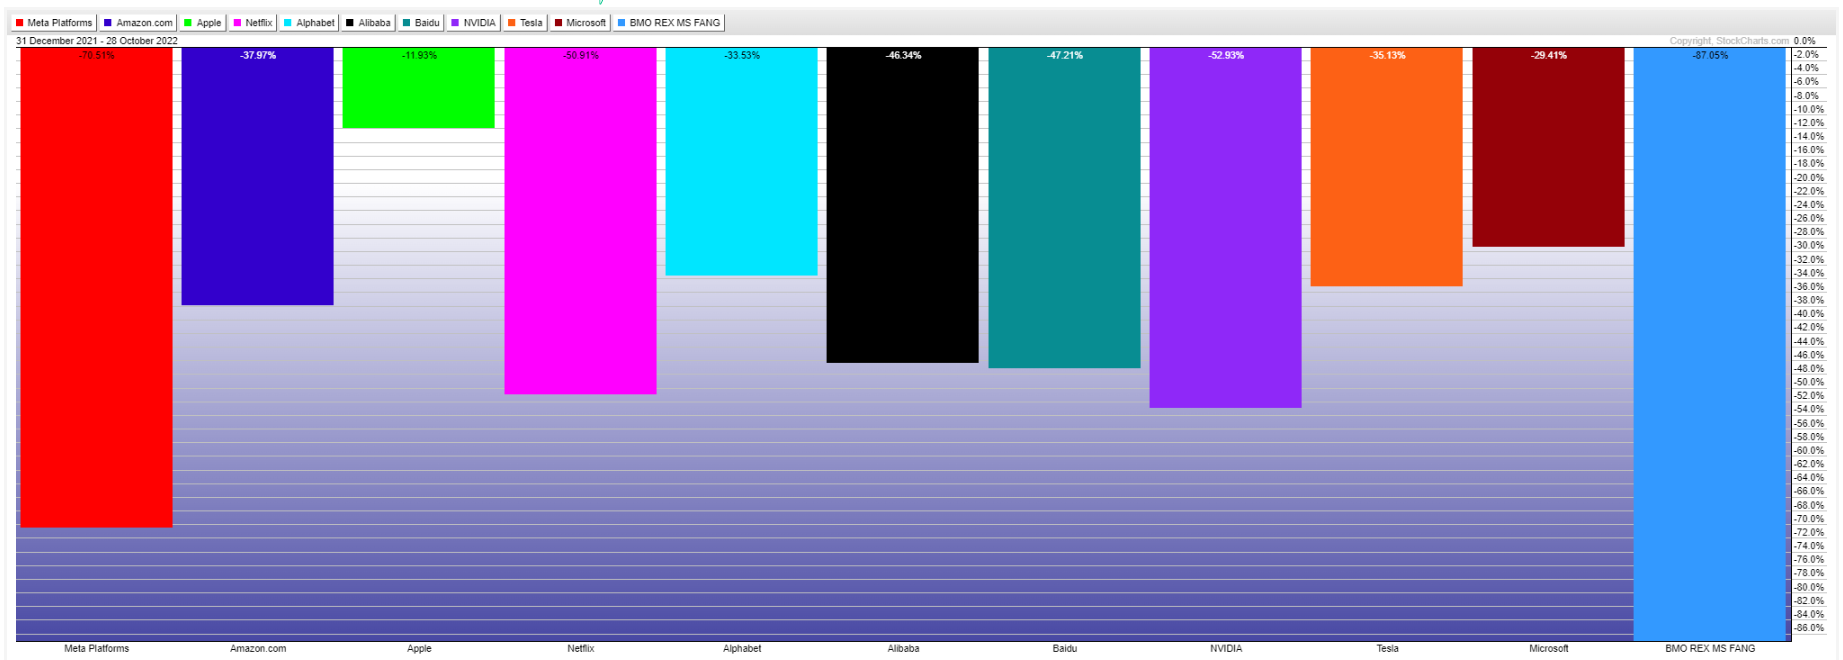
Year-to-date Percentages Gained/Lost graph
More By This Author:
World Money Flow: October Week 3, 2022
U.S. Bonds, Yields And Volatility Near Extreme Levels
BlackRock's Parabolic Plunge


Comments
Log in or sign up to join the conversation.