Meridian Bancorp, Inc. Reports Net Income For The Second Quarter And Six Months Ended June 30, 2016
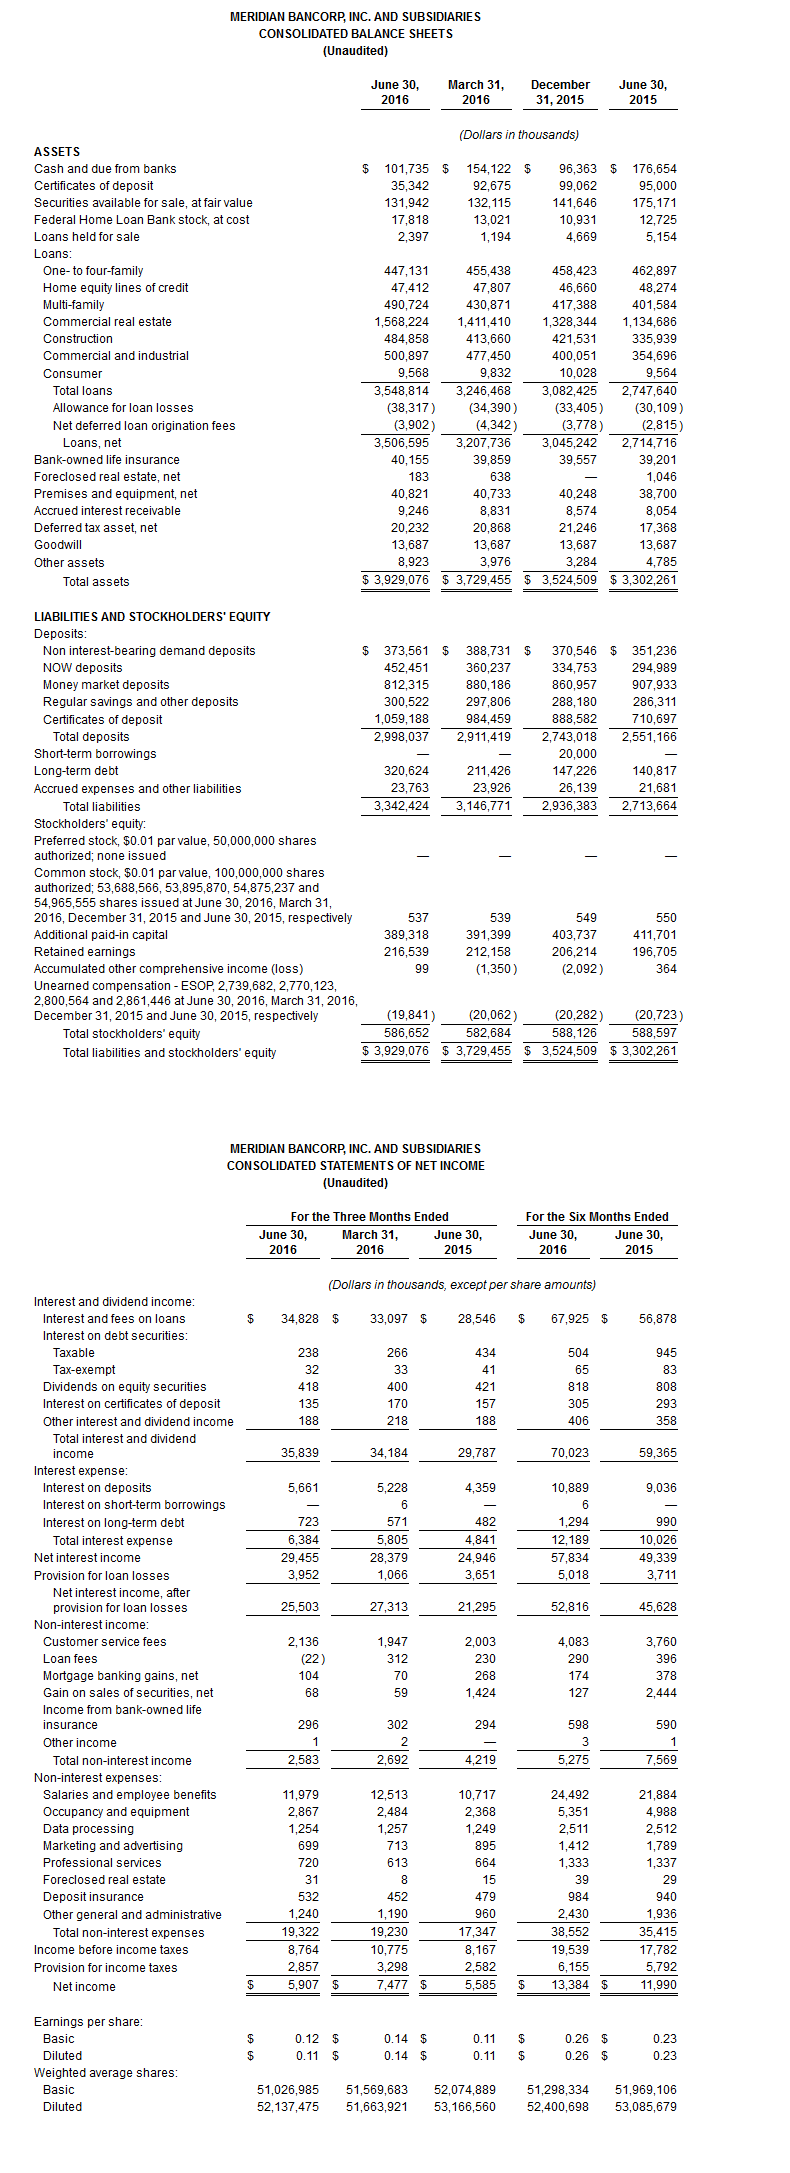
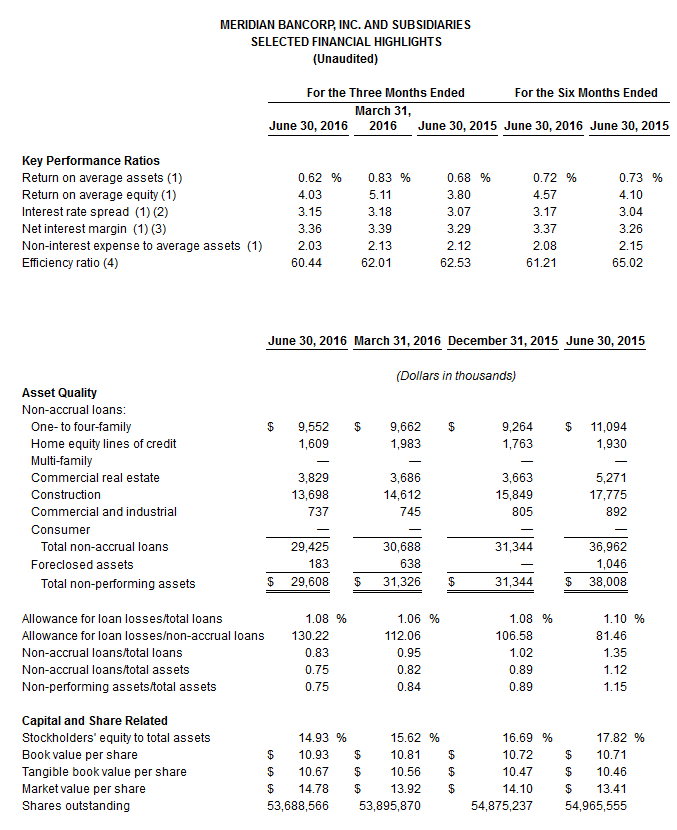
BOSTON, July 26, 2016 (GLOBE NEWSWIRE) -- Meridian Bancorp, Inc. (the “Company” or “Meridian”) (Nasdaq:EBSB), the holding company for East Boston Savings Bank (the “Bank”) announced net income of $5.9 million, or $0.11 per diluted share, for the quarter ended June 30, 2016 compared to $7.5 million, or $0.14 per diluted share, for the quarter ended March 31, 2016 and $5.6 million, or $0.11 per diluted share, for the quarter ended June 30, 2015. For the six months ended June 30, 2016, net income was $13.4 million, or $0.26 per diluted share, up from $12.0 million, or $0.23 per diluted share, for the six months ended June 30, 2015. The Company’s return on average assets was 0.62% for the quarter ended June 30, 2016 compared to 0.83% for the quarter ended March 31, 2016 and 0.68% for the quarter ended June 30, 2015. For the six months ended June 30, 2016, the Company’s return on average assets was 0.72% compared to 0.73% for the six months ended June 30, 2015. The Company’s return on average equity was 4.03% for the quarter ended June 30, 2016 compared to 5.11% for the quarter ended March 31, 2016 and 3.80% for the quarter ended June 30, 2015. For the six months ended June 30, 2016, the Company’s return on average equity was 4.57% compared to 4.10% for the six months ended June 30, 2015.

Richard J. Gavegnano, Chairman, President and Chief Executive Officer, said, “I am pleased to report net income of $5.9 million, or $0.11 per share, for the second quarter and $13.4 million, or $0.26 per share, for the first half of 2016. Our loan portfolio grew to $3.5 billion at June 30, 2016, reflecting record quarterly net loan growth of $299 million, or 37% on an annualized basis, during the second quarter and $461 million, or 30% on an annualized basis, during the first half of 2016. Due to our exceptionally strong organic growth across all our commercial loan categories, we recorded a $4.0 million loan loss provision in the second quarter. Even with the large loan loss provision, our core pre-tax income, which excludes gains on sales of securities, increased $2.0 million, or 29%, to $8.7 million for the second quarter and $4.1 million, or 27%, to $19.4 million for the first half of 2016 compared to the same periods last year, reflecting rising net interest income and improving operating efficiency. Although our core pre-tax income declined from $10.7 million for the first quarter, such income excluding the loan loss provision rose $866,000, or 7%, to $12.6 million in the second quarter.”
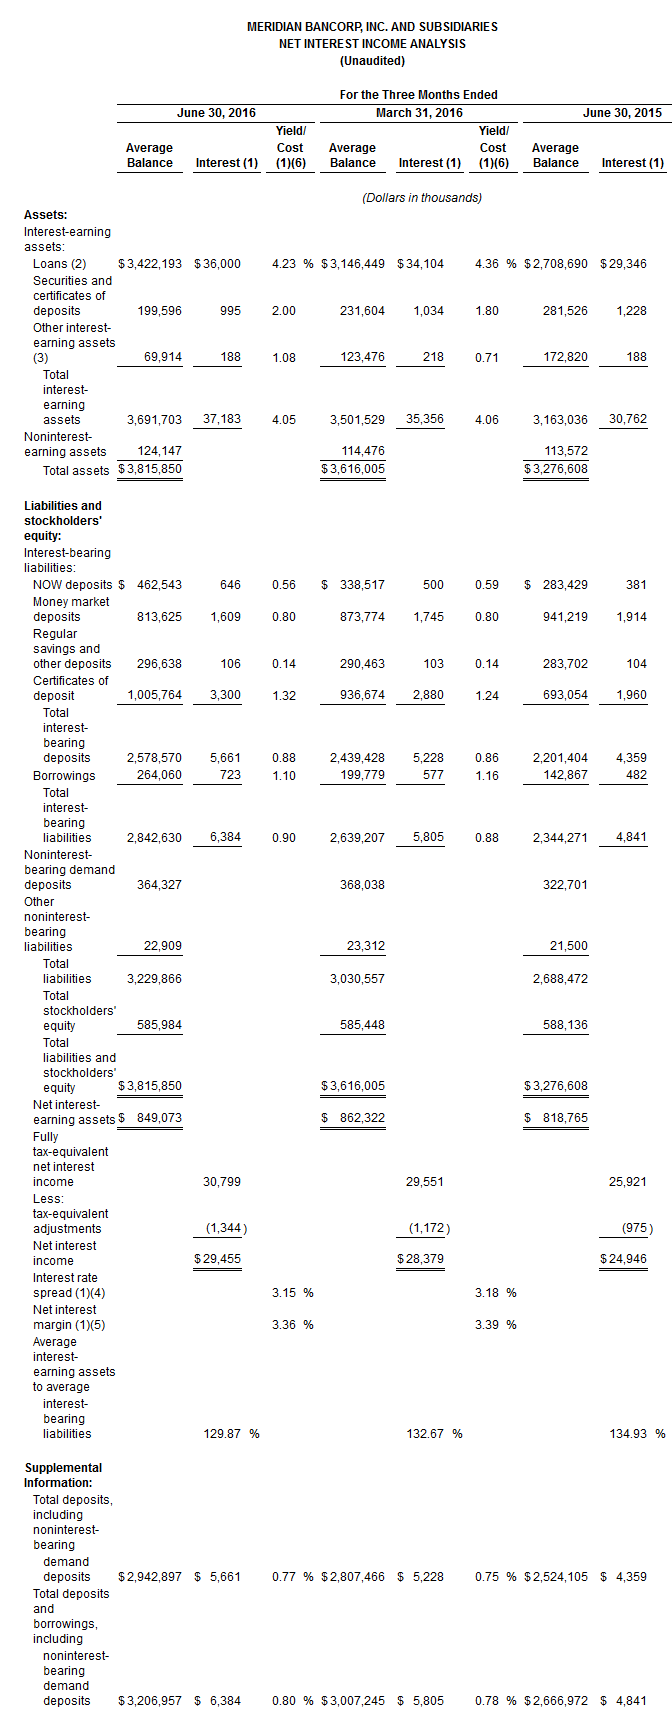
The Company’s net interest income was $29.5 million for the quarter ended June 30, 2016, up $1.1 million, or 3.8%, from the quarter ended March 31, 2016 and $4.5 million, or 18.1%, from the quarter ended June 30, 2015. The interest rate spread and net interest margin on a tax-equivalent basis were 3.15% and 3.36%, respectively, for the quarter ended June 30, 2016 compared to 3.18% and 3.39%, respectively, for the quarter ended March 31, 2016 and 3.07% and 3.29%, respectively, for the quarter ended June 30, 2015. For the six months ended June 30, 2016, net interest income increased $8.5 million, or 17.2%, to $57.8 million from the six months ended June 30, 2015. The net interest rate spread and net interest margin on a tax-equivalent basis were 3.17% and 3.37%, respectively, for the six months ended June 30, 2016 compared to 3.04% and 3.26%, respectively, for the six months ended June 30, 2015. The increases in net interest income were due primarily to loan growth, partially offset by growth in total deposits and borrowings for the quarter and six months ended June 30, 2016 compared to the respective prior periods.
Total interest and dividend income increased to $35.8 million for the quarter ended June 30, 2016, up $1.7 million, or 4.8%, from the quarter ended March 31, 2016 and $6.1 million, or 20.3%, from the quarter ended June 30, 2015, primarily due to growth in the Company’s average loan balances to $3.422 billion, partially offset by the decline in the yield on loans on a tax-equivalent basis to 4.23%. The Company’s yield on interest-earning assets on a tax-equivalent basis was 4.05% for the quarter ended June 30, 2016, down one basis point from the quarter ended March 31, 2016 and up 15 basis points from the quarter ended June 30, 2015.
Total interest expense increased to $6.4 million for the quarter ended June 30, 2016, up $579,000, or 10.0%, from the quarter ended March 31, 2016 and $1.5 million, or 31.9%, from the quarter ended June 30, 2015. Interest expense on deposits increased to $5.7 million for the quarter ended June 30, 2016, up $433,000, or 8.3%, from the quarter ended March 31, 2016 and $1.3 million, or 29.9%, from the quarter ended June 30, 2015 primarily due to the growth in average total deposits to $2.943 billion and increases in the cost of average total deposits to 0.77%. Interest expense on borrowings increased to $723,000 for the quarter ended June 30, 2016, up $146,000, or 25.3%, from the quarter ended March 31, 2016 and $241,000, or 50.0%, from the quarter ended June 30, 2015 primarily due to the growth in average total borrowings to $264.1 million, partially offset by decreases in the cost of average total borrowings to 1.10%. The Company’s cost of funds was 0.80% for the quarter ended June 30, 2016, up two basis points from the quarter ended March 31, 2016 and seven basis points from the quarter ended June 30, 2015.
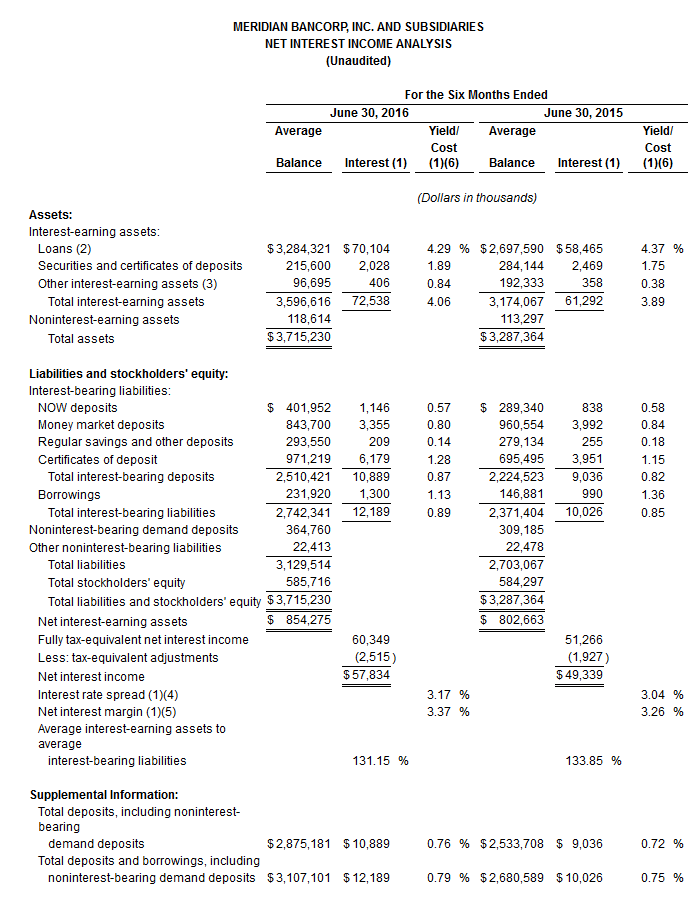
For the six months ended June 30, 2016, the Company’s total interest and dividend income increased $10.7 million, or 18.0%, to $70.0 from the six months ended June 30, 2015 primarily due to growth in the average loan balances of $586.7 million, or 21.8%, to $3.284 billion, partially offset by a decrease in the yield on loans on a tax-equivalent basis of eight basis points to 4.29% for the six months ended June 30, 2016 compared to the six months ended June 30, 2015. The Company’s yield on interest-earning assets on a tax-equivalent basis increased 17 basis points to 4.06% for the six months ended June 30, 2016 compared to 3.89% for the six months ended June 30, 2015.
Total interest expense increased $2.2 million, or 21.6%, to $12.2 million for the six months ended June 30, 2016 compared to $10.0 million for the six months ended June 30, 2015. Interest expense on deposits increased $1.9 million, or 20.5%, to $10.9 million for the six months ended June 30, 2016 from the six months ended June 30, 2015 primarily due to the growth in average total deposits of $341.5 million, or 13.5%, to $2.875 billion and an increase in the cost of average total deposits of four basis points to 0.76%. Interest expense on borrowings increased $310,000, or 31.3%, to $1.3 million for the six months ended June 30, 2016 from the six months ended June 30, 2015 primarily due to the growth in average total borrowings of $85.0 million, or 57.9%, to $231.9 million, partially offset by a decrease in the cost of average total borrowings of 23 basis points to 1.13%. The Company’ cost of funds increased four basis points to 0.79% for the six months ended June 30, 2016 compared to the six months ended June 30, 2015.
Mr. Gavegnano noted, “Our net interest income has continued to rise each consecutive quarter as total loans grew $801 million, or 29%, over the past twelve months on commercial loan originations of $1.6 billion. During that time, our net interest margin has remained fairly stable due to rising asset yields supported by our strong loan growth that effectively offsets the small rise in our cost of funds. Our lending pipeline remains strong as we continue to benefit from many opportunities to originate CRE and C&I loans through our well-established commercial relationships across the Boston area market.”
The Company's provision for loan losses was $4.0 million for the quarter ended June 30, 2016, up from $1.1 million for the quarter ended March 31, 2016 and $3.7 million for the quarter ended June 30, 2015. For the six months ended June 30, 2016, the provision for loan losses was $5.0 million compared to $3.7 million for the six months ended June 30, 2015. The allowance for loan losses was $38.3 million or 1.08% of total loans at June 30, 2016, up from $34.4 million or 1.06% of total loans at March 31, 2016, $33.4 million or 1.08% of total loans at December 31, 2015 and $30.1 million or 1.10% of total loans at June 30, 2015. The increases in the provision and the allowance for loan losses were primarily due to growth in the multi-family, commercial real estate, construction, and commercial and industrial loan categories, as such loans have higher inherent credit risk than loans in our residential real estate loan categories. The provision for loan losses and resulting allowance for loan losses also reflect management’s assessment of improving historical charge-off trends, an ongoing evaluation of credit quality and current economic conditions. The provision for loan losses for the quarter and six months ended June 30, 2015 included a $2.3 million provision and charge-off on a multi-family construction loan relationship during the second quarter of 2015.
Net charge-offs totaled $24,000 for the quarter ended June 30, 2016, or less than 0.01% of average loans outstanding on an annualized basis compared to net charge-offs of $81,000 for the quarter ended March 31, 2016, or 0.01% of average loans outstanding on an annualized basis and net charge-offs of $2.1 million for the quarter ended June 30, 2015, or 0.32% of average loans outstanding on an annualized basis. For the six months ended June 30, 2016, net charge-offs totaled $105,000, or 0.01% of average loans outstanding on an annualized basis compared to net charge-offs of $2.1 million for the six months ended June 30, 2015, or 0.15% of average loans outstanding on an annualized basis.
Non-accrual loans were $29.4 million, or 0.83% of total loans outstanding, at June 30, 2016, down from $30.7 million, or 0.95% of total loans outstanding, at March 31, 2016, $31.3 million, or 1.02% of total loans outstanding, at December 31, 2015 and $37.0 million, or 1.35% of total loans outstanding, at June 30, 2015. The decreases in non-accrual loans were primarily due to steady reductions in construction loans. Non-accrual construction loans include the $11.5 million remaining balance of a multi-family construction loan in Boston placed on non-accrual status during the second quarter of 2015. Non-performing assets were $29.6 million, or 0.75% of total assets, at June 30, 2016, down from $31.3 million, or 0.84% of total assets, at March 31, 2016, $31.3 million, or 0.89% of total assets, at December 31, 2015 and $38.0 million, or 1.15% of total assets, at June 30, 2015.
Mr. Gavegnano commented, “The loan loss provision of $4.0 million for the second quarter of 2016 reflects prudent additions to general reserve allocations resulting from the significant commercial loan portfolio growth during the quarter. Non-performing assets are steadily declining and net charge-offs are historically low. Our credit quality has improved as we continue to directly underwrite high quality commercial loans for our portfolio with strict monitoring through strong credit review and collection processes. We are also making progress toward resolution and collection of the $11.5 million remaining balance on the non-accrual construction loan in Boston.”
Non-interest income was $2.6 million for the quarter ended June 30, 2016, compared to $2.7 million for the quarter ended March 31, 2016 and $4.2 million for the quarter ended June 30, 2015.As compared to the quarter ended June 30, 2015, non-interest income decreased $1.6 million, or 38.8%, primarily due to declines of $1.4 million in gain on sales of securities, net, $252,000 in loan fees and $164,000 in mortgage banking gains, net, partially offset by an increase of $133,000 in customer service fees. For the six months ended June 30, 2016, non-interest income decreased $2.3 million, or 30.3%, to $5.3 million from $7.6 million for the six months ended June 30, 2015 primarily due to declines of $2.3 million in gain on sales of securities, net, $204,000 in mortgage banking gains, net and 106,000 in loan fees, partially offset by an increase of $323,000 in customer service fees.
Non-interest expenses were $19.3 million, or 2.03% of average assets for the quarter ended June 30, 2016, compared to $19.2 million, or 2.13% of average assets for the quarter ended March 31, 2016 and $17.3 million, or 2.12% of average assets for the quarter ended June 30, 2015. As compared to the quarter ended June 30, 2015, non-interest expenses increased $2.0 million, or 11.4%, primarily due to increases of $1.3 million in salaries and employee benefits, $499,000 in occupancy and equipment and $280,000 in other general and administrative expenses, partially offset by a decrease of $196,000 in marketing and advertising. For the six months ended June 30, 2016, non-interest expenses increased $3.1 million, or 8.9%, to $38.6 million from $35.4 million for the six months ended June 30, 2015, primarily due to increases of $2.6 million in salaries and employee benefits, $363,000 in occupancy and equipment and $494,000 in other general and administrative expenses, partially offset by a decrease of $377,000 in marketing and advertising. The increases in salaries and employee benefits expenses were primarily due to annual increases in employee compensation and health benefits during the first quarter and expenses associated with the November 2015 grant of restricted stock and stock options to the Company’s directors, officers and employees. In addition, increases in salaries and employee benefits expenses, occupancy and equipment expenses and other general and administrative expenses reflect costs associated with three new branches opened over the last twelve months. The decreases in marketing and advertising expenses reflect lower advertising production and direct mail costs and cost savings associated with the 2015 rebranding of the former Mt. Washington Bank Division into the East Boston Savings Bank brand. The Company’s efficiency ratio improved to 60.44% for the quarter ended June 30, 2016 from 62.01% for the quarter ended March 31, 2016 and 62.53% for the quarter ended June 30, 2015. For the six months ended June 30, 2016, the efficiency ratio was 61.21% compared to 65.02% for the six months ended June 30, 2015.
Mr. Gavegnano added, “Our efficiency ratio improved to new record low levels in the second quarter and first half of 2016. We will continue to execute the key components of our strategic business plan including a strong emphasis on organic commercial loan growth, selective expansion of our core banking franchise and close monitoring of our overhead expenses that we expect will result in continuing improvement in net interest income and operating efficiency.”
The Company recorded a provision for income taxes of $2.9 million for the quarter ended June 30, 2016, reflecting an effective tax rate of 32.6% for the quarter ended June 30, 2016, compared to $3.3 million for the quarter ended March 31, 2016, reflecting an effective tax rate of 30.6% and $2.6 million, or a 31.6% effective tax rate, for the quarter ended June 30, 2015. For the six months ended June 30, 2016, the provision for income taxes was $6.2 million, reflecting an effective tax rate of 31.5%, compared to $5.8 million, or 32.6%, for the six months ended June 30, 2015. The changes in the income tax provision and effective tax rate were primarily due to changes in the components of pre-tax income.
Total assets were $3.929 billion at June 30, 2016, an increase of $199.6 million, or 5.4%, from $3.729 billion at March 31, 2016 and an increase of $404.6 million, or 11.5%, from $3.525 billion at December 31, 2015.Net loans were $3.507 billion at June 30, 2016, an increase of $298.9 million, or 9.3%, from March 31, 2016 and an increase of $461.4 million, or 15.1% from December 31, 2015. Loan originations totaled $321.9 million during the quarter ended June 30, 2016 and $742.4 million during the six months ended June 30, 2016. The net increase in loans for the six months ended June 30, 2016 was primarily due to increases of $239.9 million in commercial real estate loans, $100.8 million in commercial and industrial loans, $73.3 million in multi-family loans and $63.3 million in construction loans, partially offset by a decrease of $11.3 million in one- to four-family loans. Cash and due from banks was $101.7 million at June 30, 2016, a decrease of $52.4 million, or 34.0%, from March 31, 2016 and an increase of $5.4 million, or 5.6% from December 31, 2015.Securities available for sale were $131.9 million at June 30, 2016, a decrease of $9.7 million, or 6.9%, from $141.6 million at December 31, 2015.
Total deposits were $2.998 billion at June 30, 2016, an increase of $86.6 million, or 3.0%, from $2.911 billion at March 31, 2016 and an increase of $255.0 million, or 9.3%, from $2.743 billion at December 31, 2015. Core deposits, which exclude certificate of deposits, increased $84.4 million, or 4.6%, during the six months ended June 30, 2016 to $1.939 billion, or 64.7% of total deposits. Total borrowings were $320.6 million, an increase $109.2 million, or 51.6%, from March 31, 2016 and an increase of $153.4 million, or 91.7%, from December 31, 2015.
Total stockholders’ equity was $586.7 million, an increase of $4.0 million, or 0.7%, from $582.7 million at March 31, 2016 and a decline of $1.5 million, or 0.3%, from $588.1 million at December 31, 2015. The decrease for the six months ended June 30, 2016 was primarily due to a $17.0 million repurchase of 1,220,711 shares of the Company’s common stock and two quarterly dividends of $0.03 per share totaling $3.1 million, partially offset by increases of $13.4 million in net income, $3.0 million related to stock-based compensation plans and $2.2 in accumulated other comprehensive income, reflecting an increase in the fair value of available-for-sale securities. Stockholders’ equity to assets was 14.93% at June 30, 2016, compared to 15.62% at March 31, 2016 and 16.69% at December 31, 2015. Book value per share increased to $10.93 at June 30, 2016 from $10.72 at December 31, 2015. Tangible book value per share increased to $10.67 at June 30, 2016 from $10.47 at December 31, 2015. Market price per share increased $0.68, or 4.8%, to $14.78 at June 30, 2016 from $14.10 at December 31, 2015. At June 30, 2016, the Company and the Bank continued to exceed all regulatory capital requirements.
During the quarter ended June 30, 2016, the Company repurchased 244,294 shares of its stock at an average price of $14.63 per share. As of June 30, 2016, the Company had repurchased 1,942,815 shares of its stock at an average price of $13.58 per share, or 71.0% of the 2,737,334 shares authorized for repurchase under the Company’s repurchase program as adopted in August 2015.
Mr. Gavegnano concluded, “Our plans are on track to open a second location in Brookline that will become our 31st branch by year end. We also continually evaluate new opportunities to expand our franchise footprint in the greater Boston market area and increase shareholder value.”
Meridian Bancorp, Inc. is the holding company for East Boston Savings Bank. East Boston Savings Bank, a Massachusetts-chartered stock savings bank founded in 1848, operates 30 full-service locations in the greater Boston metropolitan area. We offer a variety of deposit and loan products to individuals and businesses located in our primary market, which consists of Essex, Middlesex and Suffolk Counties, Massachusetts. For additional information, visit www.ebsb.com.
Forward Looking Statements
Certain statements herein constitute forward-looking statements within the meaning of the Private Securities Litigation Reform Act of 1995. Such statements may be identified by words such as “believes,” “will,” “expects,” “project,” “may,” “could,” “developments,” “strategic,” “launching,” “opportunities,” “anticipates,”“estimates,” “intends,” “plans,” “targets” and similar expressions. These statements are based upon the current beliefs and expectations of Meridian Bancorp, Inc.’s management and are subject to significant risks and uncertainties. Actual results may differ materially from those set forth in the forward-looking statements as a result of numerous factors. Factors that could cause such differences to exist include, but are not limited to, general economic conditions, changes in interest rates, regulatory considerations, and competition and the risk factors described in the Company’s Annual Report on Form 10-K and Quarterly Reports on Form 10-Q as filed with the Securities and Exchange Commission. Should one or more of these risks materialize or should underlying beliefs or assumptions prove incorrect, Meridian Bancorp, Inc.’s actual results could differ materially from those discussed. Readers are cautioned not to place undue reliance on these forward-looking statements, which speak only as of the date of this release.


(1) Income on debt securities, equity securities and revenue bonds included in commercial real estate loans, as well as resulting yields, interest rate spread and net interest margin, are presented on a tax-equivalent basis. The tax-equivalent adjustments are deducted from tax-equivalent net interest income to agree to amounts reported in the consolidated statements of net income. For the three months ended June 30, 2016, March 31, 2016 and June 30, 2015, yields on loans before tax-equivalent adjustments were 4.09%, 4.23% and 4.23%, respectively, yields on securities and certificates of deposit before tax-equivalent adjustments were 1.66%, 1.51% and 1.50%, respectively, and yield on total interest-earning assets before tax-equivalent adjustments were 3.90%, 3.93% and 3.78%, respectively. Interest rate spread before tax-equivalent adjustments for the three months ended June 30, 2016, March 31, 2016 and June 30, 2015 was 3.00%, 3.05% and 2.95%, respectively, while net interest margin before tax-equivalent adjustments for the three months ended June 30, 2016, March 31, 2016 and June 30, 2015 was 3.21%, 3.26% and 3.16%, respectively.
(2) Loans on non-accrual status are included in average balances.
(3) Includes Federal Home Loan Bank stock and associated dividends.
(4) Interest rate spread represents the difference between the tax-equivalent yield on interest-earning assets and the cost of interest-bearing liabilities.
(5) Net interest margin represents net interest income (tax-equivalent basis) divided by average interest-earning assets.
(6) Annualized.

(1)Income on debt securities, equity securities and revenue bonds included in commercial real estate loans, as well as resulting yields, interest rate spread and net interest margin, are presented on a tax-equivalent basis. The tax-equivalent adjustments are deducted from tax-equivalent net interest income to agree to amounts reported in the consolidated statements of net income. For the six months ended June 30, 2016 and 2015, yields on loans before tax-equivalent adjustments were 4.16% and 4.25%, respectively, yields on securities and certificates of deposit before tax-equivalent adjustments were 1.58% and 1.51%, respectively, and yield on total interest-earning assets before tax-equivalent adjustments were 3.92% and 3.77%, respectively. Interest rate spread before tax-equivalent adjustments for the six months ended June 30, 2016 and 2015 was 3.03% and 2.92%, respectively, while net interest margin before tax-equivalent adjustments for the six months ended June 30, 2016 and 2015 was 3.23% and 3.13%, respectively.
(2) Loans on non-accrual status are included in average balances.
(3) Includes Federal Home Loan Bank stock and associated dividends.
(4) Interest rate spread represents the difference between the tax-equivalent yield on interest-earning assets and the cost of interest-bearing liabilities.
(5) Net interest margin represents net interest income (tax-equivalent basis) divided by average interest-earning assets.
(6) Annualized.

(1) Annualized.
(2) Interest rate spread represents the difference between the tax-equivalent yield on interest-earning assets and the cost of interest-bearing liabilities.
(3) Net interest margin represents net interest income (tax-equivalent basis) divided by average interest-earning assets.
(4) The efficiency ratio represents non-interest expense divided by the sum of net interest income and non-interest income excluding gains or losses on securities.
Contact:
Richard J. Gavegnano,
Chairman, President and Chief Executive Officer
(978) 977-2211
Disclosure: None.


