
Medtronic Strong Quality And Reasonable Valuation
Medtronic's (MDT) stock is performing well. The industry leader in medical devices has gained over 13% in the past year, and it's currently trading at historical highs above $110 per share.
Past performance does not guarantee future returns. However, when looking at valuation ratios, cash flow distributions, and multi-factor analysis, the stock is still attractively valued for such a high-quality business.
A High-Quality Business
Medtronic is an undisputed leader in heart devices, and the company is also one of the top players in spinal products, insulin pumps, and neuromodulators, among other areas. The company has solid competitive advantages powered by brand differentiation, intellectual property, and deep relationships with physicians.
Medtronic is implementing its Enterprise Excellence plan aimed at reducing annual expenses by $3 billion by the end of fiscal 2022, and the company achieved 90 basis points in operating margin expansion due to strict cost discipline last quarter.
Moving forward, management is aggressively betting on emerging markets for growth, and this strategy is showing promising results. Revenue in emerging markets grew 12% last quarter, with China growing 11%, Eastern Europe growing 23%, and the Middle East and Africa growing 15%.
Medtronic is currently making 16% of total revenue from emerging markets. Chances are that emerging markets will keep growing at a faster rate than other markets in the years ahead, so this region should account for a larger share of total revenue over time. This should have a positive impact on revenue growth going forward.
Valuation Ratios
The table below compares Medtronic versus the average company in the healthcare sector through a wide variety of valuation ratios. Looking at price to earnings, EV/EBITDA, price to sales, price to book, price to cash flow, price to book value, and dividend yield, Medtronic's stock is priced at fairly reasonable valuation levels. In fact, the stock trades at a discount of 16% versus the sector median when averaging down the different valuation ratios.
| MDT | Sector Median | % Diff. to Sector | |
| P/E Non-GAAP (TTM) | 20.46 | 22.05 | -7% |
| P/E Non-GAAP (FWD) | 19.52 | 23.53 | -17% |
| EV/EBITDA (TTM) | 17.21 | 17.03 | 1% |
| Price/Sales (TTM) | 4.76 | 6.06 | -21% |
| Price/Sales (FWD) | 4.63 | 5.89 | -21% |
| Price to Book (TTM) | 2.89 | 3.7 | -22% |
| Price/Cash Flow (TTM) | 21.39 | 19.78 | 8% |
| Dividend Yield (TTM) | 1.91% | 1.26% | -52% |
| Average | -16% |
Source: Seeking Alpha Essential
This relative valuation comparison is not very straightforward, because Medtronic is far superior to other companies in the sector in terms of profitability. The company makes a gross profit margin of 69.98%, while the median value for the sector is 54.87%. Similarly, the EBIT margin for Medtronic is 22.14% versus a median value for the sector of 1%.
Smaller competitors may have more room for growth from a smaller revenue base if they play their cards well. But the difference in profitability is still quite favorable for Medtronic. In simple terms, investors in Medtronic are buying a top-quality company for a valuation level that is in line, or even a slight discount, versus other companies in the sector.
Importantly, valuation is always a dynamic concept as opposed to a static one. Forward-looking valuation ratios reflect a particular set of expectations regarding variables such as sales, cash flows, and earnings in the future. If the company consistently delivers numbers above market expectations, then the stock price needs to increase in order for the valuation to remain constant.
Medtronic has delivered earnings numbers above Wall Street expectations in each of the past 12 quarters, quite an impressive track record of consistent outperformance from the company.
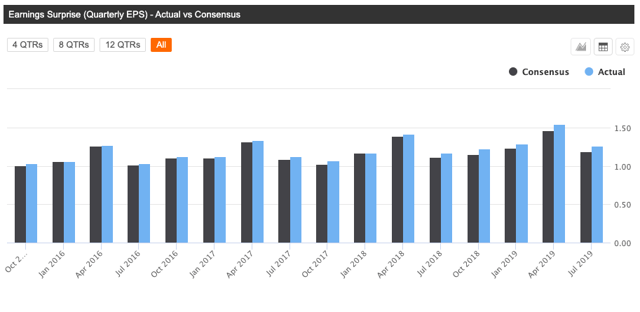
Source: Seeking Alpha Essential
Management likes to underpromise and over-deliver, as long as this remains the case, it makes sense to expect Medtronic to continue delivering earnings numbers above expectations going forward, and fundamental momentum should remain a strong tailwind for Medtronic stock.
Strong Cash Flow Distributions
It's one thing to say that a stock is cheap based on earnings or sales since this can sound like an ephemeral concept to many investors. However, when it comes to dividends and buybacks, an attractive valuation in comparison to cash distributions is far more tangible.
Medtronic is committed to returning a minimum of 50% of its free cash flow to shareholders through dividends and share repurchases. The company has raised its dividends for 42 consecutive years, which makes of Medtronic a constituent of the S&P 500 Dividend Aristocrats index.
The dividend per share has grown by 77% in the past five years, and it has produced a compounded annual growth rate of 17% per year in the past 42 years.
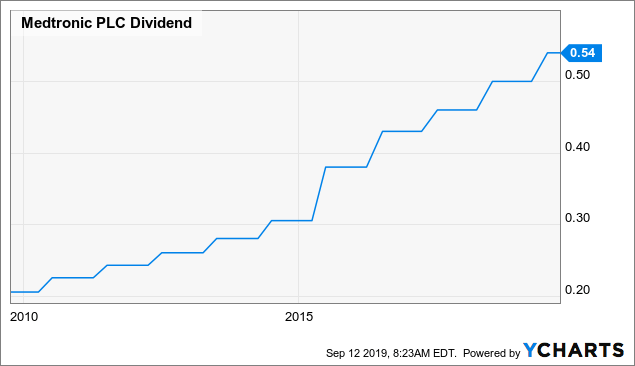
Data by YCharts
The dividend payout ratio currently stands at 41% of earnings, so Medtronic has plenty of room to continue raising dividends in the future.
The company allocates as much money to stock buybacks as to dividends nowadays. In March of 2019 the board authorized a new buyback plan of up to $6 billion. Prior to the new plan, the company had $1.3 billion in share buyback authorization left in a $5 billion plan approved in June 2017.
When considering both dividends and buybacks together, Medtronic allocated almost $5.6 billion to cash distributions in the past year. This amounts to nearly 3.9% versus the company's market capitalization.
The number represents an attractive shareholder yield coming from a financially sound business in times of historically low-interest rates. As a reference, the 10 Year US Treasury bond is yielding 1.7% as of the time of this writing.
Multi-Factor Analysis
Valuation needs to be analyzed in the context of other return drivers. A company producing strong profitability and consistently delivering earnings above expectations deserves a higher valuation than a business producing mediocre financial performance and underperforming expectations.
But sometimes it can be challenging to incorporate the multiple factors into the analysis in order to see the complete picture from a quantitative perspective. The PowerFactors system is a quantitative system that ranks companies in a particular universe according to a combination of factors, such as financial quality, valuation, fundamental momentum, and relative strength.
Here is a quick explanation of the factors considered in the algorithm:
- Financial quality includes profitability metrics such as return on assets, return on investment, return on equity, gross profit margin, operating profit margin, and free cash flow margin. The more profitable the business, the higher its ability to create profits for shareholders over the long term.
- Valuation covers typical valuation ratios such as price to earnings, price to earnings growth, price to free cash flow, and enterprise value to EBITDA. The cheaper the better, so stocks with lower valuation levels receive a higher ranking in the algorithm.
- Fundamental Momentum: This factor looks for companies that are performing better than expected and producing rising expectations, so it measures the change in earnings and sales forecasts. The bigger the increase in forecasts, the higher the score for the company in fundamental momentum.
- Relative Strength: Winners tend to keep on winning. When a stock is outperforming the market, it tends to continue doing so more often than not. For this reason, the PowerFactors system looks for stocks delivering above-average returns over different time frames.
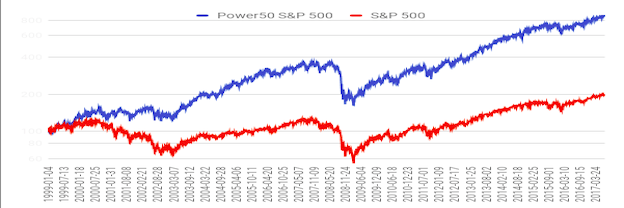
The backtested performance numbers show that companies with high PowerFactors rankings tend to deliver superior returns in the long term. The higher the PowerFactors ranking, the higher the expected returns, indicating that the system is consistent and robust.
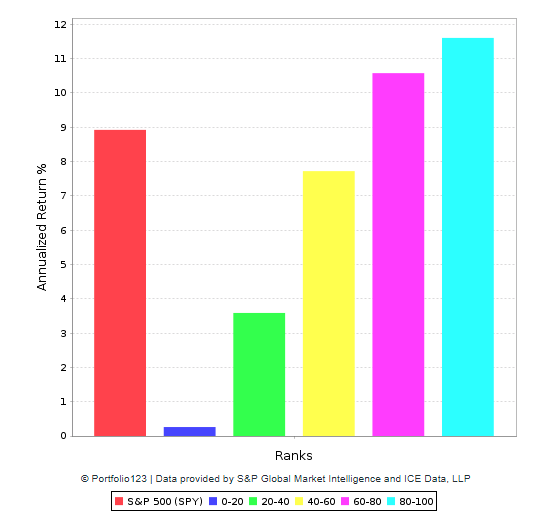
Data from S&P Global via Portfolio123
Medtronic has a PowerFactors ranking of 98.3, meaning that the stock is in the top 2% of companies in the US stock market when considering financial quality, valuation, fundamental momentum, and relative strength combined.
Looking at the different components in the PowerFactors ranking, the stock is above 80 - meaning in the top 20% - across the four dimensions. This is quite a solid configuration in terms of quantitative return drivers for Medtronic.
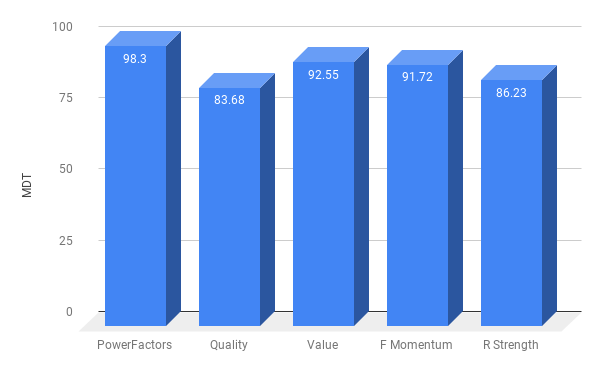
Data from S&P Global via Portfolio123
The Bottom Line
Looking at the risks, the company operates in a dynamic industry prone to technological innovation. Medtronic's competitive advantages remain as strong as ever, but this is always an important factor to monitor.
More importantly, the company's products are indirectly subject to Medicare reimbursement rates, and increasing pressure to reduce payments could have a negative impact on the business. With the presidential election approaching, chances are that the political discussion on reducing healthcare costs will create some uncertainty around the healthcare sector in general, and Medtronic's stock should not be expected to remain immune.
However, those risks are already well known by the market and incorporated into the valuation to a good degree. When considering valuation ratios, cash distributions, and multi-factor analysis, there are reasons to believe that Medtronic stock is well-positioned for attractive returns over the long term.
Disclaimer: I wrote this article myself, and it expresses my own opinions. I am not receiving compensation for it. I have no business relationship with any company whose stock is mentioned in ...
more

