
Medley Management Inc. Declares $0.20 Per Share Dividend And Reports Third Quarter 2017 Results
NEW YORK, Nov. 14, 2017 (GLOBE NEWSWIRE) -- Medley Management Inc. (NYSE:MDLY) today reported its financial results for its third quarter ended September 30, 2017.
Highlights
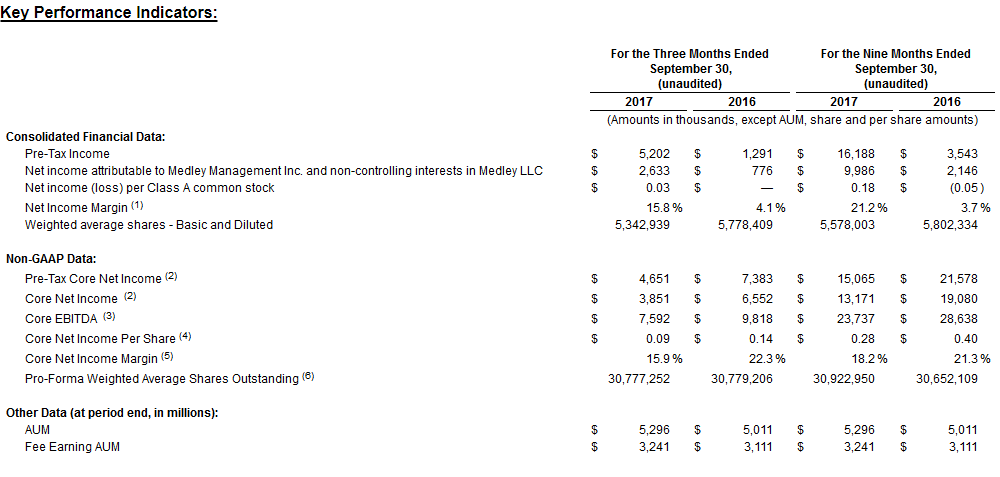
- Fee earning assets under management were $3.2 billion as of September 30, 2017
- Total assets under management were $5.3 billion as of September 30, 2017
- Declared $0.20 per share dividend for Q3 2017 payable on December 6, 2017
- U.S. GAAP net income attributable to Medley Management Inc. was $0.03 per share for Q3 2017
- Core Net Income Per Share was $0.09 for Q3 2017
"The third quarter of 2017 was another consistent quarter for Medley where we saw increased investment activity across our platform. We continue to grow our investment capabilities and our team and I am pleased to announce the filing for our first public real estate fund, Sierra Real Estate Fund," said Brook Taube, CEO of Medley.
Results of Operations for the Three Months Ended September 30, 2017
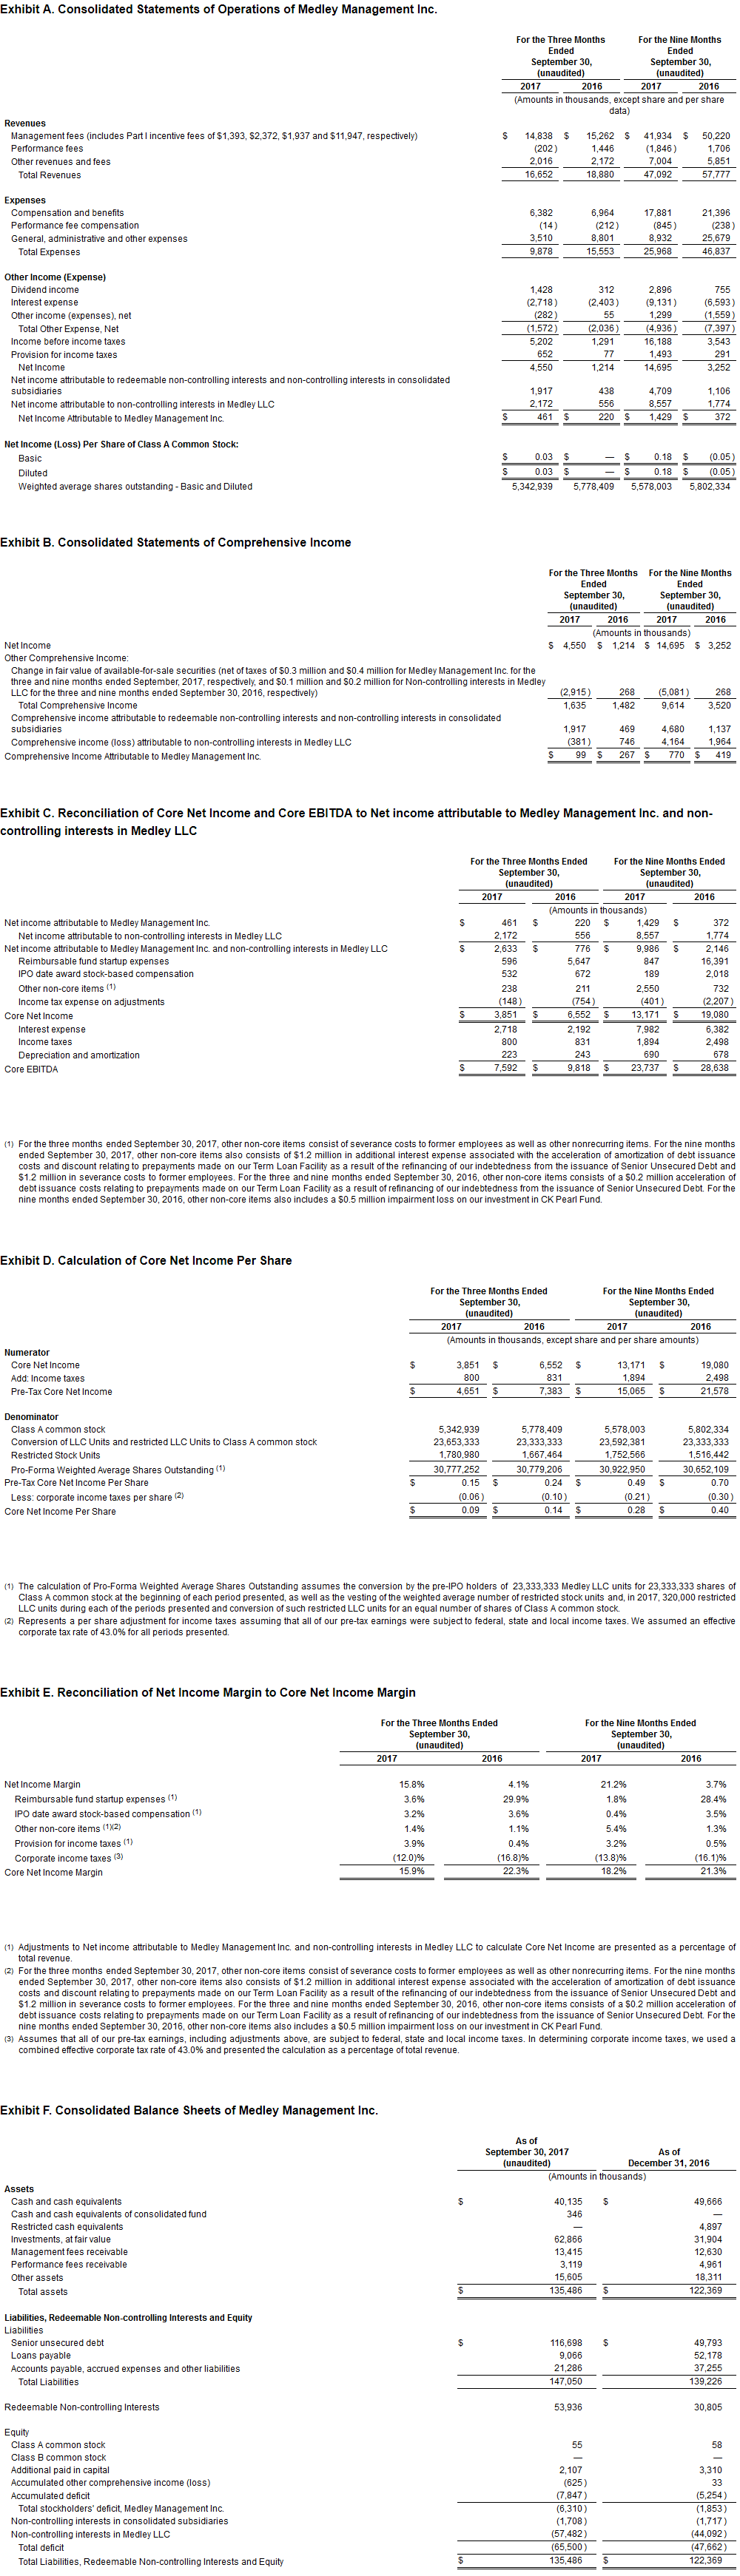
Total revenues were $16.7 million for the three months ended September 30, 2017 compared to $18.9 million for the same period in 2016. The decrease was due primarily to a decrease in performance and incentive fees.
Total expenses from operations were $9.9 million for the three months ended September 30, 2017 compared to $15.6 million for the same period in 2016. The decrease was due primarily to a decrease in expenses associated with our expense support agreement with Sierra Income Corporation ("SIC") as well as a reduction in compensation and benefits expense, partly offset by an increase in general, administrative and other expenses.
Total other expense, net was $1.6 million for the three months ended September 30, 2017 compared to $2.0 million for the same period in 2016. The decrease was due primarily to a decrease in expense associated with our revenue share payable and an increase in dividend income from our permanent capital vehicles, partly offset by an increase in interest expense.
Net income attributable to Medley Management Inc. and non-controlling interests in Medley LLC was $2.6 million for the three months ended September 30, 2017 compared to $0.8 million for the same period in 2016. Medley Management Inc.’s net income per share was $0.03 for the three months ended September 30, 2017 compared to $0.00 for the same period in 2016.
Pre-Tax Core Net Income was $4.7 million for the three months ended September 30, 2017 compared to $7.4 million for the same period in 2016. Core Net Income Per Share was $0.09 for the three months ended September 30, 2017, compared to $0.14 for the same period in 2016. Core EBITDA was $7.6 million for the three months ended September 30, 2017 compared to $9.8 million for the same period in 2016.
Results of Operations for the Nine Months Ended September 30, 2017
Total revenues were $47.1 million for the nine months ended September 30, 2017 compared to $57.8 million for the same period in 2016. The decrease was due primarily to a decrease in performance and incentive fees, partly offset by an increase in other revenue and fees.
Total expenses from operations were $26.0 million for the nine months ended September 30, 2017 compared to $46.8 million for the same period in 2016. The decrease was due primarily to a reduction in expenses associated with our expense support agreement with SIC, a reduction in compensation and benefits expense, a decrease in performance compensation and lower general and administrative expenses.
Total other expense, net was $4.9 million for the nine months ended September 30, 2017 compared to $7.4 million for the same period in 2016. The decrease was due primarily to a decrease in expense associated with our revenue share payable and an increase in dividend income, partly offset by an increase in interest expense.
Net income attributable to Medley Management Inc. and non-controlling interests in Medley LLC was $10.0 million for the nine months ended September 30, 2017 compared to $2.1 million for the same period in 2016. Medley Management Inc.’s net income per share was $0.18 for the nine months ended September 30, 2017 compared to a net loss per share of $0.05 for the same period in 2016.
Pre-Tax Core Net Income was $15.1 million for the nine months ended September 30, 2017 compared to $21.6 million for the same period in 2016. Core Net Income Per Share was $0.28 for the nine months ended September 30, 2017, compared to $0.40 for the same period in 2016. Core EBITDA was $23.7 million for the nine months ended September 30, 2017 compared to $28.6 million for the same period in 2016.
Investor Contact:
Sam Anderson
Head of Capital Markets & Risk Management
Medley Management Inc.
212-759-0777
Media Contact:
Erin Clark
Teneo Strategy
646-214-8355
| (1) | Net Income Margin equals Net income attributable to Medley Management Inc. and non-controlling interests in Medley LLC divided by total revenue. | |
| (2) | Pre-Tax Core Net Income is calculated as Core Net Income before income taxes. Core Net Income reflects net income attributable to Medley Management Inc. and net income attributable to non-controlling interests in Medley LLC adjusted to exclude reimbursable expenses associated with the launch of funds, stock-based compensation associated with restricted stock units that were granted in connection with our IPO, other non-core items and the income tax expense associated with the foregoing adjustments. Please refer to the reconciliation of Core Net Income to Net income attributable to Medley Management Inc. and non-controlling interests in Medley LLC in Exhibit C for additional details. | |
| (3) | Core EBITDA is calculated as Core Net Income before interest expense, income taxes, depreciation and amortization. Please refer to the reconciliation of Core EBITDA to Net income attributable to Medley Management Inc. and non-controlling interests in Medley LLC in Exhibit C for additional details. | |
| (4) | Core Net Income Per Share is calculated as Core Net Income, adjusted for the income tax effect of assuming that all of our pre-tax earnings were subject to federal, state and local corporate income taxes, divided by Pro-Forma Weighted Average Shares Outstanding (as defined below). We assumed an effective corporate tax rate of 43.0% for all periods presented. Please refer to the calculation of Core Net Income Per Share in Exhibit D for additional details. | |
| (5) | Core Net Income Margin equals Core Net Income Per Share divided by total revenue per share. | |
| (6) | The calculation of Pro-Forma Weighted Average Shares Outstanding assumes the vesting of restricted stock units and conversion by the pre-IPO holders of 23,333,333 LLC Units for 23,333,333 shares of Class A common stock at the beginning of each period presented, respectively. Please refer to Exhibit D for additional details. |
Fee Earning AUM
The table below presents the quarter-to-date roll forward of our total fee earning AUM:
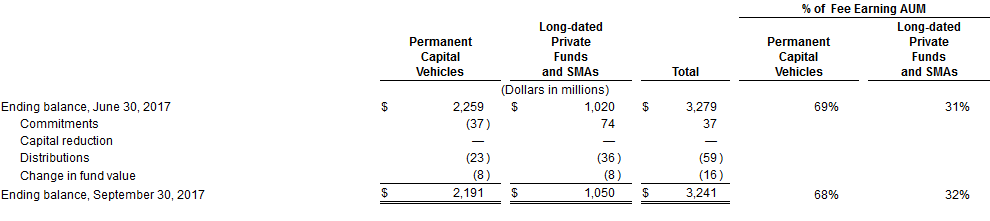
Total fee earning AUM decreased by $38 million, or 1% as of September 30, 2017 compared to total fee earning AUM as of June 30, 2017. The permanent capital vehicles’ share of fee earning AUM decreased to 68% as of September 30, 2017 compared to June 30, 2017.
The table below presents the year-to-date roll forward of our total fee earning AUM:
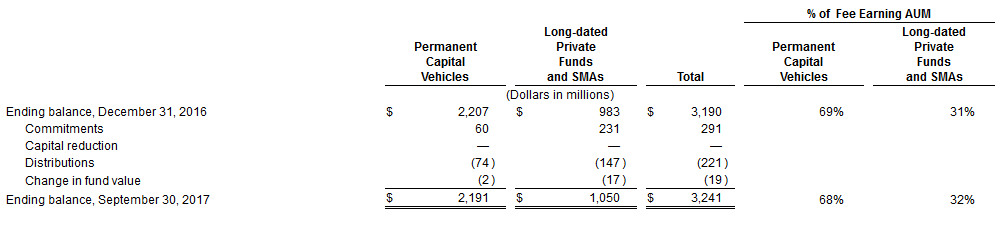
Total fee earning AUM increased by $51 million, or 2% as of September 30, 2017 compared to total fee earning AUM as of December 31, 2016. The permanent capital vehicles’ share of fee earning AUM decreased to 68% as of September 30, 2017 compared to December 31, 2016.
Dividend Declaration
On November 8, 2017, the Company’s Board of Directors declared a quarterly dividend of $0.20 per share of Class A common stock for the third quarter of 2017. The dividend will be paid on December 6, 2017 to stockholders of record as of November 24, 2017.
Conference Call and Webcast Information
We will host an earnings conference call and audio webcast at 10:00 a.m. (Eastern Time) on Tuesday, November 14, 2017 to discuss our third quarter financial results.
All interested parties may participate in the conference call by dialing (877) 524-5743 approximately 5-10 minutes prior to the call. International callers should dial (615) 247-0088. Participants should reference Medley Management Inc. and the conference ID of 97423481 when prompted. Following the call you may access a replay of the event via audio webcast. This conference call will be broadcast live over the Internet and can be accessed by all interested parties through the Company's website, http://www.mdly.com. To listen to the live call, please go to the Company's website at least 15 minutes prior to the start of the call to register and download any necessary audio software. For those who are not able to listen to the live broadcast, a replay will be available shortly after the call on the Company’s website.
About Medley
Medley is an alternative asset management firm offering yield solutions to retail and institutional investors. Medley’s national direct origination franchise, with over 85 people, is a premier provider of capital to the middle market in the U.S. As of September 30, 2017, Medley has over $5 billion of assets under management in two business development companies, Medley Capital Corporation (NYSE:MCC) and Sierra Income Corporation, a credit interval fund, Sierra Total Return Fund (Nasdaq:SRNTX) and several private investment vehicles. Over the past 15 years, Medley has provided capital to over 400 companies across 35 industries in North America¹.
Medley LLC, the operating company of Medley Management Inc., has outstanding bonds which trade on the NYSE under the symbols (NYSE:MDLX) and (NYSE:MDLQ). Medley Capital Corporation (NYSE:MCC) has outstanding bonds which trade on the NYSE under the symbols (NYSE:MCV) and (NYSE:MCX).
Forward-Looking Statements
Statements included herein may contain "forward-looking statements." Statements other than statements of historical facts included in this press release may constitute forward-looking statements and are not guarantees of future performance or results and involve a number of assumptions, risks and uncertainties, which change over time. Actual results may differ materially from those anticipated in any forward-looking statements as a result of a number of factors, including those described from time to time in filings by the Company with the Securities and Exchange Commission, including those described in the section “Risk Factors” in the Company’s Annual Report on Form 10-K for the fiscal year ended December 31, 2016. Except as required by law, the Company undertakes no duty to update any forward-looking statement made herein. All forward-looking statements made herein speak only as of the date of this press release.
Non-GAAP Financial Measures
We make reference to certain non-GAAP financial measures in this press release. A reconciliation of these non-GAAP financial measures to the most directly comparable financial measures calculated and presented in accordance with U.S. GAAP is contained in the tables attached hereto.
Non-GAAP measures used by management include Pre-Tax Core Net Income, Core Net Income, Core EBITDA, Core Net Income Per Share and Core Net Income Margin. Management believes that these measures provide analysts, investors and management with helpful information regarding our underlying operating performance and our business, as they remove the impact of items management believes are not reflective of underlying operating performance. These non-GAAP measures are also used by management for planning purposes, including the preparation of internal budgets; and for evaluating the effectiveness of operational strategies. Additionally, we believe these non-GAAP measures provide another tool for investors to use in comparing our results with other companies in our industry, many of whom use similar non-GAAP measures. There are limitations associated with the use of non-GAAP financial measures as compared to the use of the most directly comparable U.S. GAAP financial measure and these measures supplement and should be considered in addition to and not in lieu of the results of operations discussed below. Furthermore, such measures may be inconsistent with measures presented by other companies.
This press release does not constitute an offer for any Medley fund.
Available Information
Medley Management Inc.’s filings with the Securities and Exchange Commission, press releases, earnings releases and other financial information are available at www.mdly.com.
1. Medley Management Inc. is the parent company of Medley LLC and several registered investment advisors (collectively,"Medley”). Assets under management refers to assets of our funds, which represents the sum of the net asset value of such funds, the drawn and undrawn debt (at the fund level, including amounts subject to restrictions) and uncalled committedcapital (including commitments to funds that have yet to commence their investment periods). Assets under management are as of September 30, 2017.
Disclosure: None.


