
Market Weekly Review: Returning To Uncharted Territory
The S&P 500 had a resoundingly positive week with gains throughout every single session. Expectations are a little more elevated heading into Q1’19 earnings season, where we can depend more on business fundamentals rather than broad economic measures to drive expectations in stock market gains. There was enough good news in terms of economics to keep bulls on board the market (which we will discuss more in detail).

Source: Google
The S&P 500 started the week at 2,848 before grinding its way up to 2,892 representing a net-advance for the first week of April of 1.5%. The markets are just shy of 2,923, so we’re only 1% away from the previous market all-time high.
Barring any unforeseen surprises during April earnings season, the markets will trend to new all-time highs, which returns us back to uncharted territory where chart indicators become less dependable and we look to various measures of economic productivity, market specific risk factors, and business fundamentals (proprietary signals not tied to price formations) to determine the degree to which markets can sustain gains at even higher price levels.
Unemployment figures were strong this week
The main driver for optimism was the unemployment figures this week, which kept the unemployment rate at 3.8% or flat between the month of February and March. The prior-month unemployment figures were relatively weak with nonfarm payroll growth of 38K versus March figures of 196K. Labor force gains in the month of March were strong when compared to February. Investors were worried that economic condition could worsen in the prior month. Recent unemployment data implies that the U.S. economy will resume upwards to the usual 200K to 300K payroll additions (we’ve grown accustomed to), which disarms concerns tied to the economy, but it also drives concerns of further Fed tightening in the foreseeable quarters.
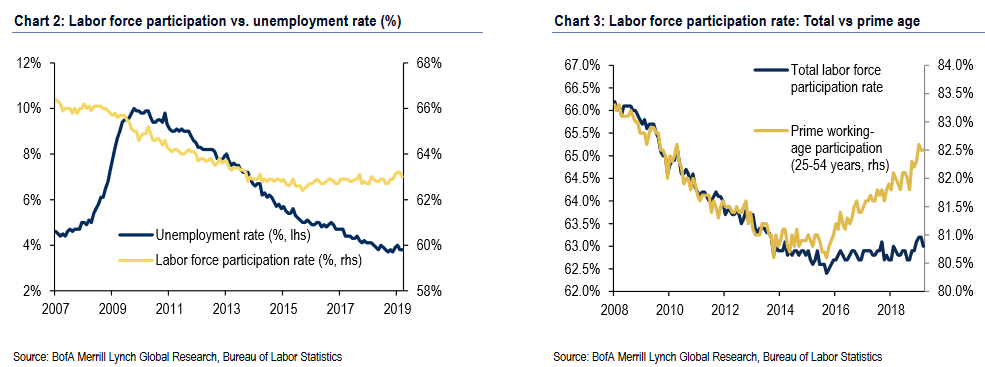
Source: Bank of America Merrill Lynch
Labor force participation has trended particularly higher in the prime-working cohort among people who are between the working ages of 25-54 years old from 81% in 2014 all the way up to 82.5% in 2019. The aggregate labor participation rate has trended sideways, there’s a couple ways to interpret the data, but generally speaking the addition of more job applicants, or people looking for work have gone up but job absorption was able to keep pace, hence the unemployment figure has hovered sideways over the past six months (unemployment range of 3.8%-4%).
Participation in 2019 isn’t near prior market highs from 2007, as we’re still shy of 66% labor participation versus the current labor participation rate of approximately 63% to 64%, which puts less pressure on the unemployment rate. Some of the reasons for why unemployment remains a little rangebound has a lot to do with household formations or population growth that tends to range from 0.7% to 0.9% per year (so to move the needle on employment) the U.S. economy has to produce 2.287 million additional jobs this year just to keep pace with population. You then apply the labor force participation rate against that figure, which is currently 63% and the U.S. economy needs to produce 1.44 million jobs this year just to keep the unemployment rate flat, but with the addition of jobs likely to range from 200k to 300k for the duration of the year we could add anywhere from 2.4 million jobs to 3 million jobs this year, which will push the unemployment rate lower, but by a very marginal factor when adjusting for population growth (hence the reasoning for unemployment remaining tightly rangebound historically).
Credit markets, yield curve flattening, and U.S. defaults trending slightly higher than usual
The credit markets or more specifically the U.S. treasury bond market yield curve inversion is starting to reverse or normalize towards a flattening curve (and perhaps hopefully a steepening yield curve). Currently, the three-month treasury yield is trading at 2.44% versus 10-year yields trading at 2.5%, so market conditions in lending might not actually worsen as badly as anticipated. Whenever longer-term debt trades at lower interest rates when compared to shorter duration bonds underwriting activity for commercial and industrial loans tends to slow or tighten. However, these trends are likely to abate for a while, as lending activity in other segments of the economy might be picking-up with auto sales data stronger, but with corporate defaults also trending higher.
Quoted from S&P Global Ratings:
Global corporate default tally rose to 34 this week following seven defaults. Five of the defaults were U.S.-based, increasing the U.S. tally to 24 (71% of the total).”The current default tally is 25% higher than the tally at this point in 2018 and 42% higher than the tally at this point in 2017,” said Diane Vazza, head of S&P Global Fixed Income Research. Bankruptcy is the leading cause of defaults this year, with 11 (32%) all of which were U.S.-based. If this trend continues, this will be the first year since 2010 in which bankruptcy will be the leading cause of default.
Financial conditions appear mixed–while some indicators have somewhat rebounded following the steep tightening in the fourth quarter, we expect this is temporary. In turn, we expect the default rate to rise in 2019 to 3.1% from 2.4%. We see U.S. growth slowing to 2.2% this year–more in line with the economy’s structural potential growth–as the fiscal stimulus from tax cuts wane just as cumulative tightening of monetary policy weighs on growth.
While credit conditions in the United States are expected to tighten (perhaps steeper underwriting standards) the default rate isn’t expected to substantially worsen. Most of the macro models I have been able to review suggests a modest increase in loan loss write offs tied to subprime lending, but not to the extent that it would impact economic fundamentals to the point where we’re entering into a recession, but perhaps softer GDP growth figures this year, which is more or less in-line with expectations tied to most macroeconomists (what’s contributing to somewhat of a slowdown in GDP growth is the anticipated effect of defaults this year).
M&A Activity is starting to slow down a little

Source: Mergermarket
For those looking for M&A fueled trades this year, the M&A volumes have started to slowdown a little by 15% this year across the world. Despite a 15% drop-off in M&A globally, North America experienced a more modest contraction of 4.1% in M&A activity in terms of dollar figures from prior-year with total M&A activity of $439 Billion. The modest drop-off in M&A could be driven by a number of factors, but generally speaking investors can still anticipate some interesting trade set-ups on the basis of M&A related activity.
Structurally speaking, smaller companies are still attractive on the basis of M&A potential. Ignoring the largest transactions in the group, when shopping for stocks that might be acquired the sectors that seem to be exhibiting the most M&A growth (currently) are Pharmaceuticals, Industrials/Chemicals and also Financial Services.
Most loved and hated stocks among hedge fund managers

Source: Bank of America Merrill Lynch
Hedge fund managers have been most aggressive on Incyte Corporation, IQVIA Holdings, Twenty-Century Fox, Capri Holdings and TransDigm Group. The most hated stocks by short-interest were Nordstrom, Microchip Technology, Mattel, H&R Block and Hormel Foods. Why this is the case? I’m not exactly certain, but this is where there’s the strongest bearish/bullish divergence among institutions.
Institutional managers have been positioning into energy, industrials and healthcare (on average). Whereas the most commonly shorted stocks fall under discretionary sector, i.e. retail-oriented stocks that might not have as much of a defensible business moat and could be facing some secular stagnation tied to bigger firms taking disproportionate market share (such as Amazon versus Grocers and Retail), or because some of the discretionary stocks are individual under-performers (companies exhibiting a narrative of decelerating or declining revenue/earnings comparisons and with a shaky history of delivering upon analyst estimates). Tech disruptors tend to negatively affect certain sectors more disproportionately and could become less relevant or less desirable businesses when compared to alternatives tied to software, automation, or internet-equivalents.
Perhaps, the most interesting holding among hedge fund managers was the perceived upside in energy stocks (tied primarily to the recovery in U.S. crude). The price of crude oil has trended higher (persistently) from the one-year low set on December 24, 2018 at $42.53 versus the current price of $63.08. The energy stocks were a little undervalued starting out the year, and now the trade could be a little crowded, as the production/supply issues that hit the oil market have started to diminish in the past couple weeks, and analysts are also trimming expectations on pricing getting too far ahead of $70 per/bbl. Nonetheless, energy stocks were relatively attractive among hedge funds due to the crude oil price recovery, but crude oil prices might not stay on such a strong trajectory for much longer, which is why the crowded trade may eventually unwind as expectations on crude pricing starts to consolidate or normalize into a tighter trading range.

Source: Bloomberg
Following that, industrial sector stock had the second most exposure among hedge funds, it’s a bit more cyclical but could be undervalued, or where value asset managers have been buying-up stocks in areas like shipping, manufacturing (perhaps stocks that trade below book value or undervalued relative to forward earnings). The third most favored category were pharmaceuticals, but this is understandable given the massive up-tick in M&A deal-related activity, and the perceived value of certain drug portfolios that could reach FDA approval over the next couple of years (expectations have gotten more elevated in this segment).
Final thoughts
Investors will need to dig across the markets a little more this year, especially because we’re near new all-time-highs, and so price gains could be a little slower beyond 2,900 S&P 500. A number of secular-growth stories sound interesting, but it really depends on where you’re looking to generate investment returns. The expectations tied to lending-related losses, diminished Investment Bank underwriting activity makes financials a little less attractive whereas M&A focused investors may find opportunities in Pharmaceuticals. Energy stocks have rallied on the back of higher oil prices (however the trend in oil prices could lead to a consolidation soon), whereas secular losers to tech-cohort companies like retail, and perhaps some business services have filled up the loser column, and it’s where hedge fund managers are shorting stocks.
Economic data seems to be improving, and so the economy isn’t the biggest risk factor for investors this year. Investors should anticipate an unwinding in the bond markets where yields could steepen as opposed to inversion, as the recent yield curve inversion seems like a temporary blip due to aggressively conservative bond flows. Investors will continue to pile into stocks in the foreseeable month, and from there we’ll see some earnings catalysts drive stocks on the basis of growth outlook, or expectations beats, leaving me with a sense of optimism or anticipation of stocks returning back to uncharted territory where we will continue the 10-year market run.
Disclaimer: TipRanks is an independent cloud based service that measures and ranks digitally published financial advice. TipRanks' natural language processing (NLP) algorithms aggregate and ...
more

