

|
Indicator |
Weekly Level / Change |
Implication for S & P 500 |
Implication for Nifty* |
|
S & P 500 |
2837, -1.32% |
Bearish |
Bearish |
|
Nifty |
9154, -1.21% |
Neutral ** |
Bearish |
|
China Shanghai Index |
2809, -1.06% |
Bearish |
Bearish |
|
Gold |
1746, -2.64% |
Bearish |
Bearish |
|
WTIC Crude |
17.19, -5.91% |
Bearish |
Bearish |
|
Copper |
2.34, 0.00% |
Neutral |
Neutral |
|
Baltic Dry Index |
665, -11.45% |
Bearish |
Bearish |
|
Euro |
1.0821, -0.52% |
Bearish |
Bearish |
|
Dollar/Yen |
107.54, -0.00% |
Neutral |
Neutral |
|
Dow Transports |
8092, -1.72% |
Bearish |
Bearish |
|
High Yield (Bond) |
96.62, -3.51% |
Bearish |
Bearish |
|
US 10 year Bond Yield |
0.61%, -5.80% |
Bullish |
Bullish |
|
Nyse Summation Index |
-277, 31.08% |
Bullish |
Neutral |
|
US Vix |
35.93, -5.82% |
Bullish |
Bullish |
|
Skew |
127 |
Neutral |
Neutral |
|
20 DMA, S and P 500 |
2708, Above |
Bullish |
Neutral |
|
50 DMA, S and P 500 |
2808, Above |
Bullish |
Neutral |
|
200 DMA, S and P 500 |
3008, Below |
Bearish |
Neutral |
|
20 DMA, Nifty |
8768, Above |
Neutral |
Bullish |
|
50 DMA, Nifty |
10043, Below |
Neutral |
Bearish |
|
200 DMA, Nifty |
11247, Below |
Neutral |
Bearish |
|
S & P 500 P/E |
20.61 |
Bearish |
Neutral |
|
Nifty P/E |
20.34 |
Neutral |
Bearish |
|
India Vix |
39.18, -8.16% |
Neutral |
Bullish |
|
Dollar/Rupee |
76.27, -0.37% |
Neutral |
Neutral |
|
Overall |
S & P 500 |
Nifty |
|
|
Bullish Indications |
5 |
4 |
|
|
Bearish Indications |
10 |
12 |
|
|
Outlook |
Bearish |
Bearish |
|
|
Observation |
The S and P 500 and the Nifty fell last week. Indicators are bearish for the week. The markets have begun a great depression style collapse. Watch those stops. |
||
|
On the Horizon |
Japan – BOJ rate decision, US – FOMC rate decision, GDP, Eurozone – ECB rate decision, CPI, German employment data |
||
|
*Nifty |
India’s Benchmark Stock Market Index |
||
|
Raw Data |
Courtesy Stock charts, investing.com, multpl.com, NSE |
||
|
**Neutral |
Changes less than 0.5% are considered neutral |
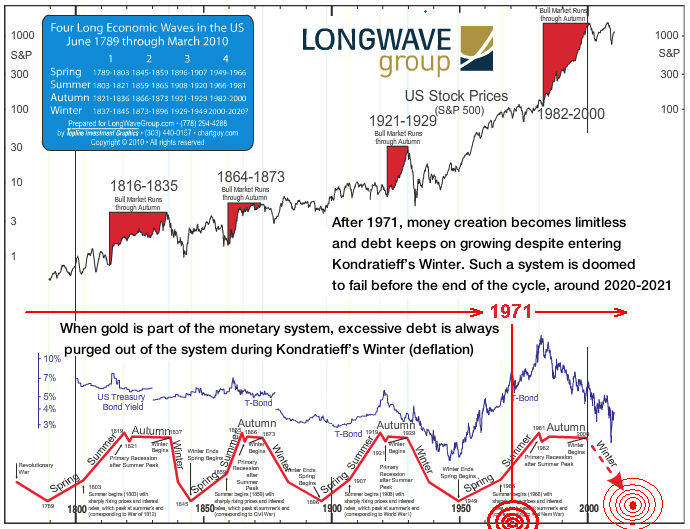
The S&P and the Nifty fell last week. Indicators are bearish for the coming week. The S&P is failing again and it is headed to 1800. Long term, the epic meltdown is set to continue resulting in a 5-year plus bear market with lot lower levels maybe as low as 800 on the S&P. QE forever from the Fed is about to trigger the deflationary collapse of the century, and we have made a major top in global equity markets. The market is looking like the short of a lifetime with non-conformations from the transports, other global indices and commodities. High valuations continue. The breakdown in Crude and the Euro is a precursor to yet another massive drop in the S and P 500. The recent global virus epidemic (black swan) is likely to dent global GDP significantly and usher in a depression much faster than most think. The trend has changed from bullish to bearish and the markets are getting smashed by a strong dollar. Looking for significant under performance in the Nifty going forward on rapidly deteriorating macros. A 5-year deflationary wave has started in key asset classes like the Euro, stocks and commodities amidst a number of bearish divergences and over stretched valuations. We are entering a multi-year great depression. The markets are still trading well over 3 standard deviations above their long term averages from which corrections usually result. Tail risk has been very high off late as the yield curve inverts into a recession. The critical levels to watch for the week are 2850 (up) and 2825 (down) on the S&P 500 and 9250 (up) and 9050 (down) on the Nifty. A significant breach of the above levels could trigger the next big move in the above markets. You can check out last week’s report for a comparison. Love your thoughts and feedback.


Comments
Log in or sign up to join the conversation.