
Margin Of Safety Saves The Day In A DCF Valuation Of Harley-Davidson
I recently stumbled across an old discounted cash flow (DCF) model from mid-2006 that I built for Harley-Davidson (HOG, formerly HDI) as I was weighing whether to invest. I thought it would be fun to assess my process from the vantage point of 2019.
In June 2006, HOG’s stock chart looked like this compared to the S&P 500 over the previous 5 years:
(Click on image to enlarge)

Source: Yahoo Finance
It was up almost 13% vs. SPY, but in the year prior it had had a pretty big mid-year tumble, from $62 to $45, reaching around $54 by the end of June ’06. This brought it to a relative value that made it worth taking a look at.
The main reason HOG had come across my radar, however, was its dividend. It had steadily grown its dividend to the point where its dividend yield (as of mid-June 2006) was about 1.28%. My minimum screener threshold is usually around 1.0%. Here’s HOG’s recent dividend history at the time:
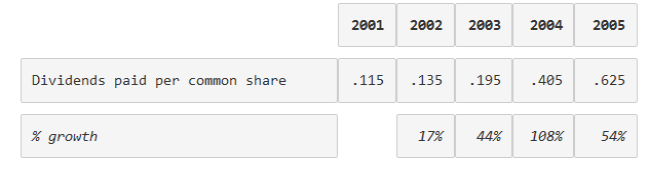
That’s a strong, consistent dividend growth rate!
With a company like Harley-Davidson, I already knew quite a bit about their products, so there was less digging necessary. Here are some highlights from my research (mostly quantitative, since anything qualitative is gone):
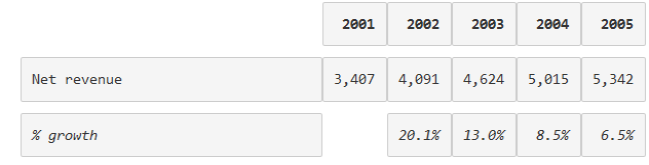
- Overall sales growth had been solid, especially during the economic weakness from 2001-2003, but it had slowed of late — which is was concerning given the strength of the worldwide economy by that point.
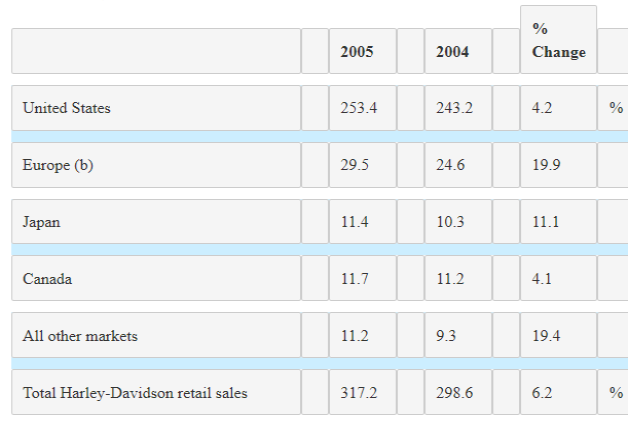
- US sales were up slightly, while international sales were more robust but were still only 20% of the total. It seemed like there was room to run internationally, but US and European heavyweight motorcycle markets would probably not grow much, so the main opportunity in those two largest markets was to take share (a difficult proposition).
- Harley’s financing division was also growing, and at a slightly faster rate than sales. This was under 6% of sales, though, so I didn’t consider it hugely material.
- EV/EBITDA was around 8.2, so didn’t look expensive.
- FCF/Sales was around 12%, so it’s obviously not a massive FCF generator, but it was OK, and the dividends were decent and growing. The actual dividend payout was around $174M, so it was covered by FCF 3.5x. The dividend seemed pretty safe.
- As brands and products go, I rated HOG as very strongly differentiated.
Valuation
My preferred valuation method is a DCF analysis. Here’s how I did it:
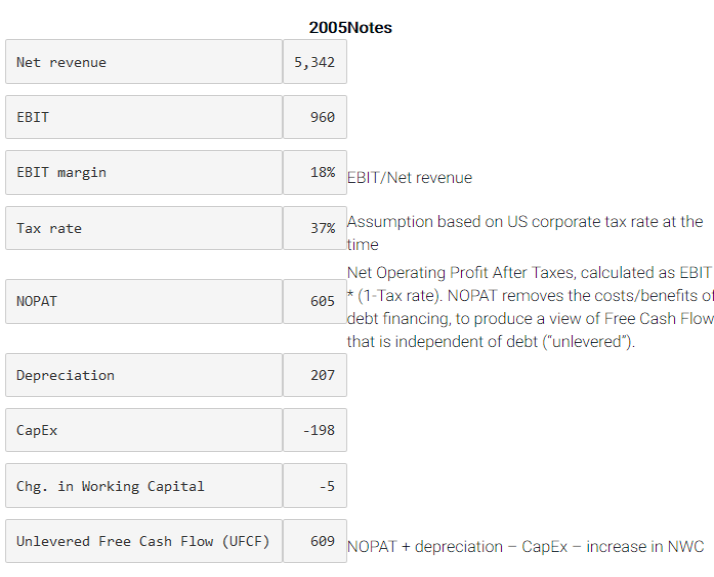
From here, sometimes I forecast out each of these line items separately, and sometimes I forecast out just the UFCF. In 2006, I did the former, but since then, I usually do the latter as I’ve come to realize it’s a lot of extra work for a false feeling of precision. You most often get a very similar result, anyway.
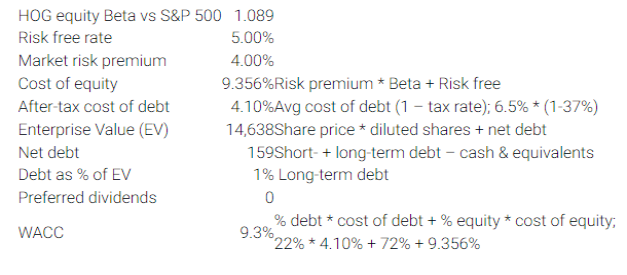
Discount rate
For the discount rate, I calculated HOG’s weighted average cost of capital (WACC). (I’ve since changed my perspective on how to discount future cash flows. I’ll write about this soon, but to put it simply, investors should discount relative to their own hurdle rate or opportunity cost, factoring in their assessment of the riskiness of an investment. This rate is probably not the same as the company’s cost of capital.) Anyway, here’s how I did it back then:
The DCF
I assumed a 6% UFCF growth rate, with a 3% terminal rate (back when inflation was close to that). That yields:
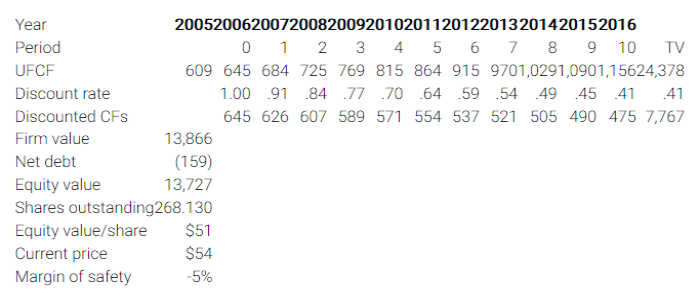
This ended up not being all that close. HOG looked close to being fairly valued, with no margin of safety. With slowing sales growth and a growing-but-low dividend yield, it wasn’t compelling. Did I think the company would be around in 10 or 20 years? For sure. But for a stable company in a stable, mature market, there didn’t seem like enough opportunity given the price at the time.
In terms of my process, looking back, it seems pretty solid. A good company came across my radar, and I had the discipline to not buy it even after a lot of research given the lack of a margin of safety. And thank goodness for that!
Outcomes
So, what happened? The stock pretty quickly hit a high of $75 in November 2006. It reported solid earnings at the end of September, but I’m not quite sure what propelled it to those highs in the two months after that. In any case, that’s the highest it ever got.
Soon after that high, things started going wrong. There was a strike at one of its factories in early 2007, shutting down production for a month. This hurt the stock in the short term, but then things went from bad to worse with the Great Recession. Not only did its motorcycle sales plummet worldwide, but its financing division had a some write offs of bad debt.
(Click on image to enlarge)

Source: Yahoo Finance
It’s down 37% since then to around $36, while the S&P 500 is up 100%. Sure, it’s had dividends along the way, and as the price dropped, the yield increased, but that doesn’t make it attractive.

The dividends per share dropped for years before they got back to the levels they were in 2006. The dividends help make the capital loss a little less, but not by much.
The thing that strikes me is the revenue:

When I first did this, I simply took the 2005 revenue and trended it out at 6% a year. That looks insane now: 2017 revenue was almost identical to 2005 revenue. Dig a little deeper, and you can see they changed the way they state things. Before, Financial Services was not included in net revenue. Now, having doubled in size, it’s included. The real comparable number vs. what I used on 2005 is $4.9B, which is lower than the $5.3B in 2005. Even worse!
Obviously, I was not predicting the downturn of 2008. There’s no way I could have factored that into my DCF valuation. But it really highlights the need for the margin of safety. If I could have gotten HOG for a 25% discount to its fair value, or around $38, I might’ve done it. That might have helped me preserve my capital better, though it’s impossible to know. (Maybe the stock would be at $20 today if it had been at $38 then.)
The company is still around after 13 years, so that assumption of my thesis held true. Its current price now is right about that level I would’ve bought in 2006, and its current dividend yield is above 4%.
Still, declining sales since 2014? And now, with the international economy in trouble and the US in a late cycle, we know that vehicle sales are going nowhere but down. This is not a good trend.
Current valuation
But for giggle, let’s take a quick look at how things stand today. At $35.71 and with largely similar metrics as when I looked in 2006, maybe now is a good time to buy?
A quick, back-of-the-envelop calculation puts its UFCF at a similar level as 2005, around $673M. (That puts its dividend coverage at ~2.7, which isn’t worrisome territory — yet.)
To do a quick DCF, you can use OSV’s valuation tool. I put in $673M as the start value with a 2% growth rate and terminal rate. I used an 8% discount rate. Even though the risk-free rate and the equity risk premium are lower than in 2006, HOG’s solvency issues seem like a fairly decent risk for me to take on as an investor, and there a good alternatives for my cash at that level and above. I used 8%, but I could be convinced to make it even higher. When you do that, you end up with this:

Again, it’s almost exactly at fair value. I see greater downside risks for the company right now, some of which are baked into my DCF.
Maybe if it drops another 25% from where it is, and I can get my margin of safety, I would think about it. At that level, their dividend yield would be even more attractive, too. I’d have to look a lot more at their debt, though.


