
MacroView: A Permanent Shift In Valuations?
During extended bull markets, rationalization becomes commonplace to justify overpaying for value. One such rationalization is the permanent shift in valuations higher due to changes in accounting rules, share buybacks, and greater adoption by the public of investing (aka ETFs.)
The chart shows the apparent shift to valuations.
- The “median” CAPE ratio is 15.24 times earnings from 1871-1980.
- The long-term “median” CAPE is 16.52 times earnings from 1871-Present (all-years)
- The “median” CAPE is 22.91 times earnings from 1980-Present.
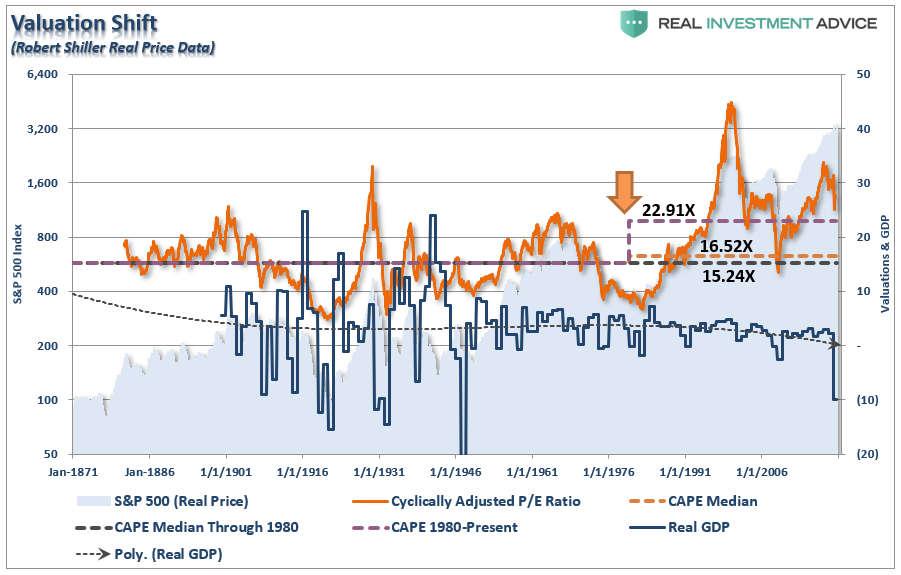
There are two critical things to consider concerning the chart above.
- The shift higher in MEDIAN valuations was a function of falling economic growth and deflationary pressures; and,
- Increasing levels of leverage and debt, which eroded economic growth, facilitated higher prices.
A General Deficit
The chart below tracks the cumulative increase in “excess” Government spending above revenue collections. Notice the point at which nominal GDP growth stopped rising. It is also the point that valuations shifted higher.
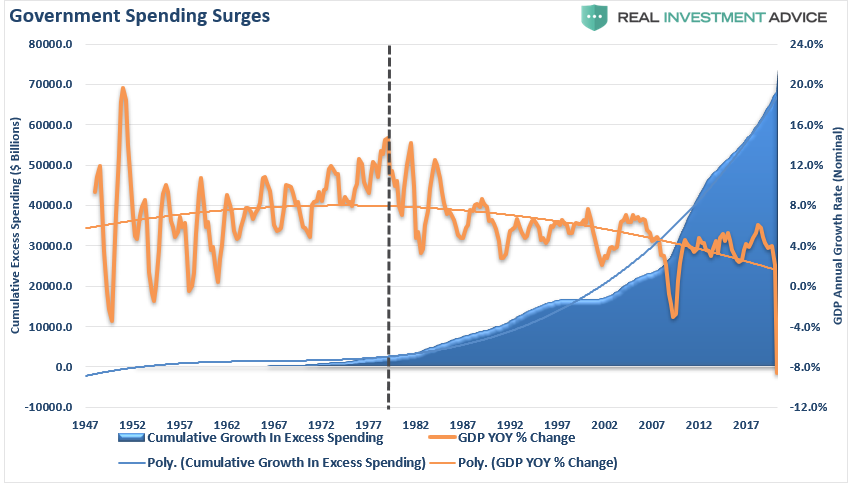
You can see this shift occur more clearly when looking at when the government began to run a deficit consistently. Rising deficits directly correlate with weaker rates of economic growth.
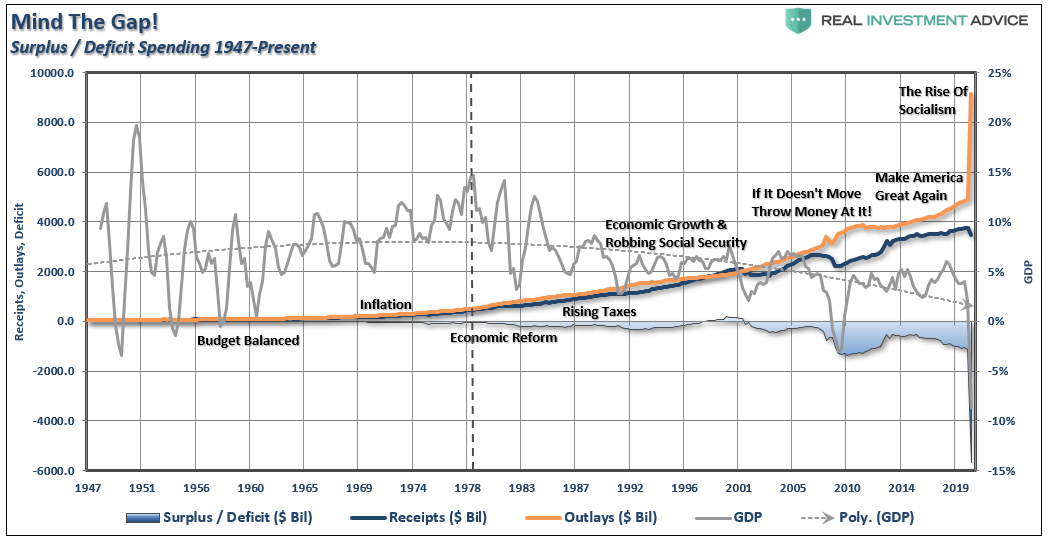
Given that economic leverage (corporate, consumer, financial, and Government debt) is at records and rising, the ability to create more robust, sustainable, economic growth (which would lead to higher rates of inflation) remains little more than a hopeful goal. (Read 5 Reasons The Fed Will Fail)
The problem with the idea that valuations have permanently shifted upward is the market anomaly form 1990-2000 skewed valuations above the long-term medians. However, given economic growth remains mired at 2%, or less,over the long-term, average valuation ranges will begin to trend lower in the future.
Confirmation
Such was a point Ed Easterling of Crestmont Research previously made:
“However, as real economic growth significantly declined over the past two decades, it triggered a series of adjustments that represent the forces behind The Big Shift. Most importantly, the downshift in real economic growth disrupted the financial relationship of profits, future growth, and market value.
Slower growth drives P/E downward for similar reasons that it drives EPS upward.”
Of course, as noted above, since the “Financial Crisis” lows, much of the rise in “profitability” has come from cost-cutting measures and accounting gimmicks rather than actual increases in top-line revenue. While tax cuts certainly provided the capital for a surge in buybacks, revenue growth, which connects to a consumption-based economy, remained muted. Now, the “economic shutdown” has crushed revenue growth entirely. As detailed in “Earnings Don’t Support The Bullish Thesis:”
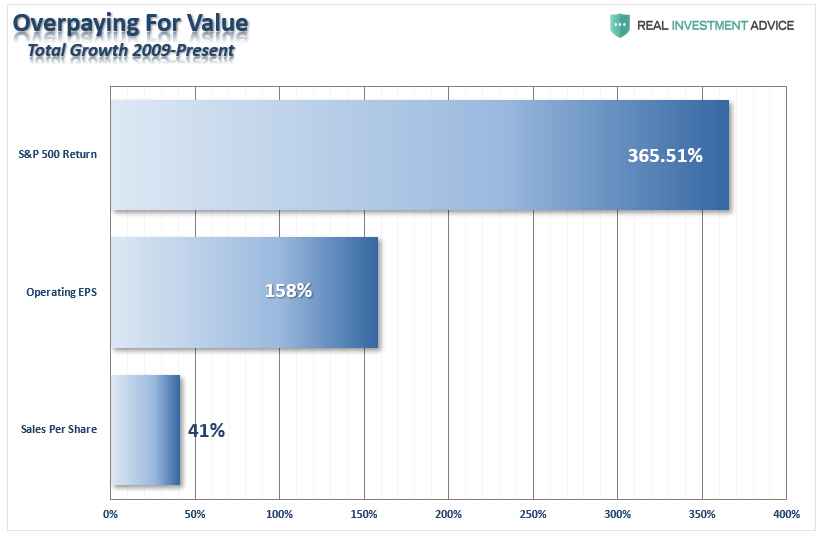
“Since 2009, the operating earnings per share of corporations has risen by just 158%. However, the increase in earnings did not come from an increase in revenue. During the period, sales (which is boosted due share reductions) grew by a marginal 41%.
However, investors have bid up the market more than 365% from the financial crisis lows of 666.”
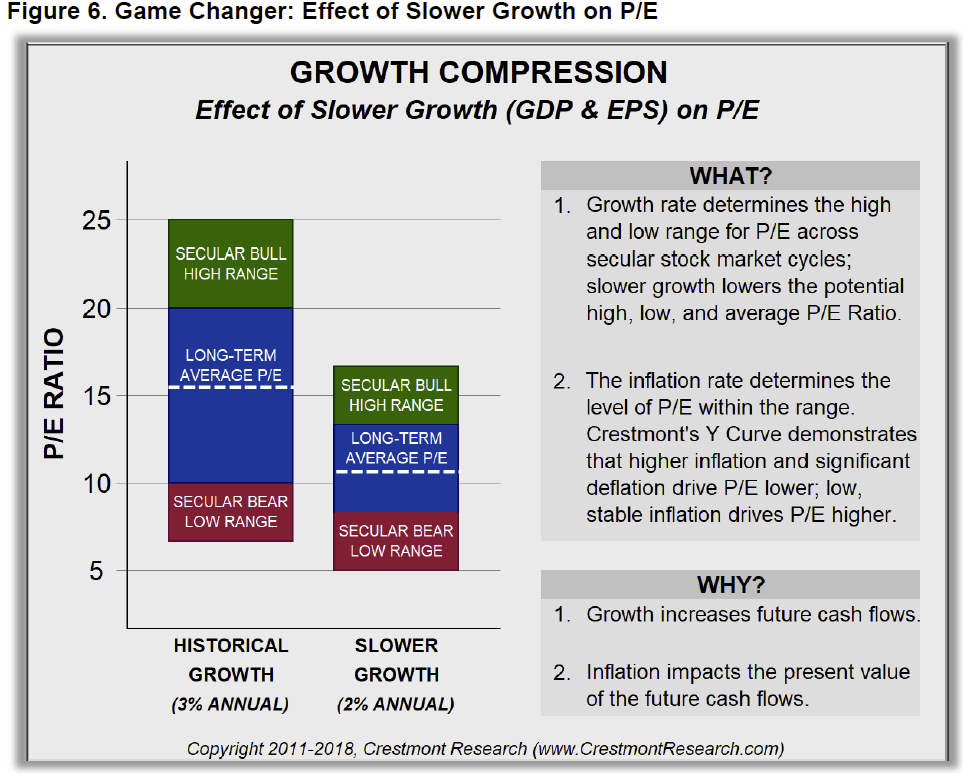
Effect Of Slower Growth
Furthermore, to this point, Ed digs into the overarching problem:
“Therefore, since future economic growth is expected to be slower, it is only consistent that the future average for the market P/E will be lower. The new normal growth rate (i.e., slower) for the economy will drive slower overall earnings growth. Such slower growth will drive market P/E lower, just as previously higher growth supported the market’s P/E at a higher level.
The inflation rate also drives the level of market P/E, but it occurs within the range driven by the growth-rate environment. Higher inflation drives P/E lower; deflation drives P/E lower. The level of P/E peaks when the inflation rate is low and stable. Thus, while the growth rate drives the level of the P/E range, the inflation rate drives the relative position of P/E within the range.
Figure 6 illustrates these effects. The bar on the left illustrates the range for P/E under a historically average level of growth. The bar to its right illustrates the range for P/E under slower growth. Not only does the range downshift, the expected long-term average P/E also downshifts. This has major implications for analyzing the stock market.”
Value Is What You Pay
“Going forward, we should expect a new paradigm. Slower growth drives the ranges for P/E lower, which will affect future assessments of fair value. Keep in mind that, had real economic growth averaged 2% instead of 3.3% over the past century, the historical average for P/E would have been near 11—not 15 or 16. In the future, the fair value for P/E when the inflation rate is low will be 13 to 15. With average inflation, expect P/E to be near 11. During periods of high inflation and significant deflation, expect the low range for P/E to be 5 to 8.”
With markets currently trading near 30x earnings, a revaluation will be just as painful to investors in the future as they have previously.
While this time may indeed appear to be different, it will most likely end the same as every other period in history.
“Price is what you pay; value is what you get.” – Warren Buffett.
Starting Valuations Matter Most
When discussing valuations, the starting level when you begin your investment journey is the most critical. Such was a point discussed previously:
“The chart below shows the history of secular bull market periods going back to 1871 using data from Dr. Robert Shiller. You will notice that secular bull markets tend to begin with CAPE 10 valuations around 10x earnings or even less. They tend to end around 23-25x earnings or higher. (Over the long-term valuations do matter.) “
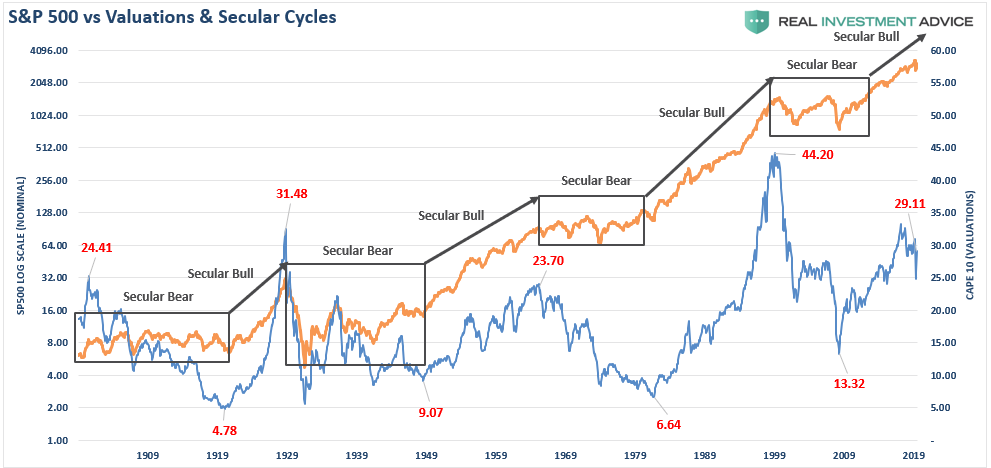
The two previous 20-year secular bull markets start with valuations in single digits. At the end of the first decade of those temporal advances, valuations were still trading below 20x. Currently, valuations are still hovering near 30x.
But that is just today. Over the next couple of quarters, the “E” will drop markedly as the impact of the economic shutdown settles in. While investors hope there will only be a mild-reduction in earnings, historically, earnings have reverted past the long-term exponential trend.
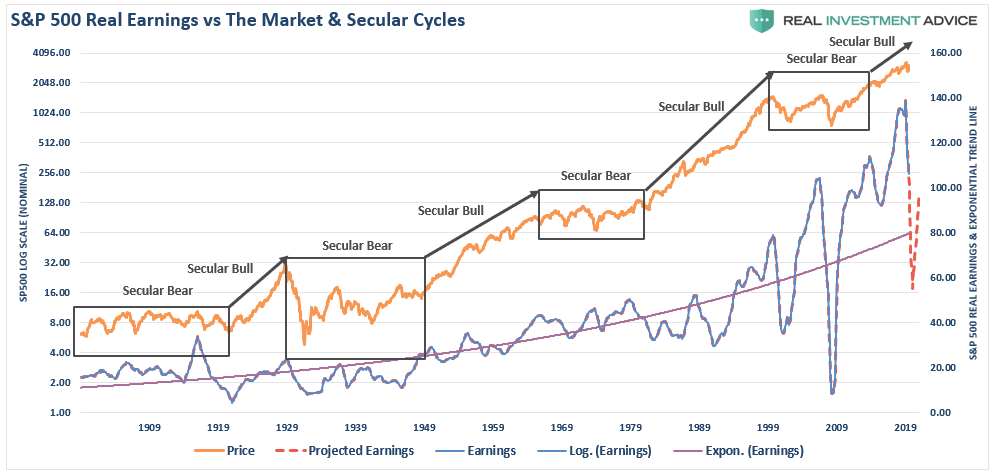
Given 13% unemployment rates and a recession of nearly 20%, earnings will likely revert toward $80/share. Such a decline will push current valuations to historically high levels assuming prices remain elevated.
The 1920-1929 secular advance most closely mimics the current 2010 cycle. While valuations started below 5x earnings in 1919, they eclipsed 30x earnings ten-years later in 1929. The rest, as they say, is history. Or instead, maybe “past is prologue” is more fitting.
Overpaying For Value On Every Measure
The mistake investors repeatedly make dismissing the data in the short-term because there is no immediate impact on price returns. As noted above, valuations by their very nature are HORRIBLE predictors of 12-month returns. Investors avoid any investment strategy which has such a focus. In the longer term, however, valuations are strong predictors of expected returns.
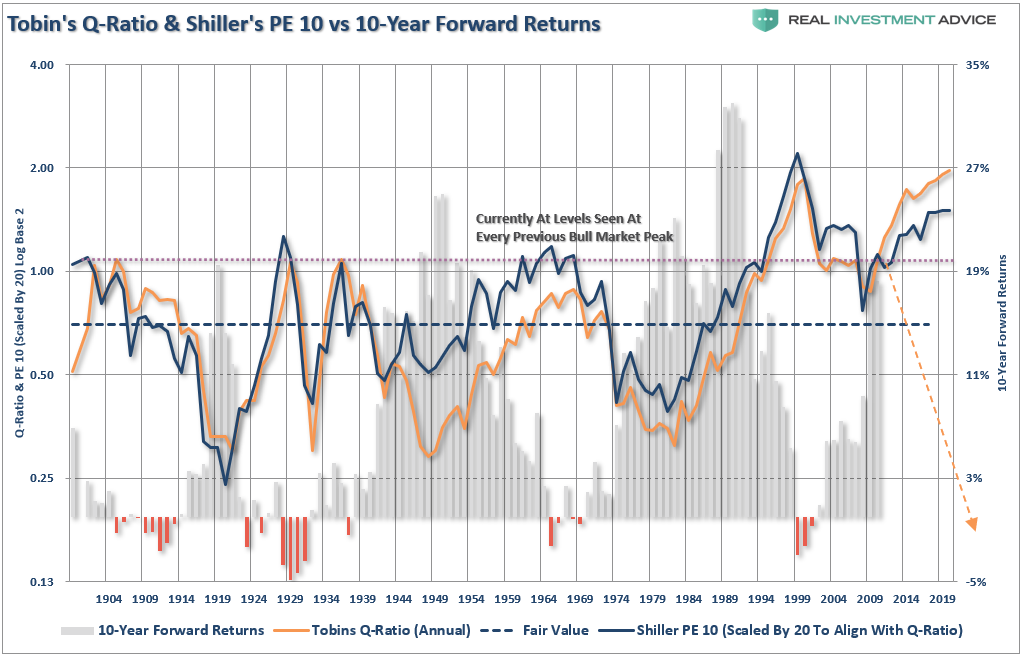
It isn’t just trailing valuations suggesting markets are overpriced and expensive. The chart below shows Dr. Robert Shiller’s cyclically adjusted P/E ratio compared with Tobin’s Q-ratio. The Q-ratio measures the “replacement cost” for the firm’s assets in the broad Wilshire 5000 index. (This measure has nothing to do with earnings.)
Unsurprisingly, Tobin’s Q is also at historically expensive valuations hitting the highest level since the peak in 2000. Furthermore, note forward 10-year returns do NOT improve from historically expensive levels but decline sharply.
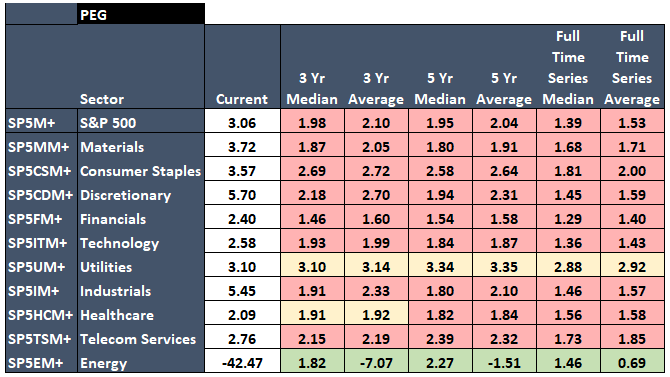
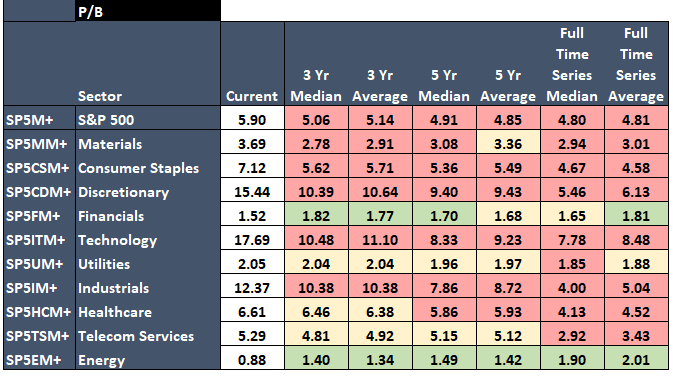
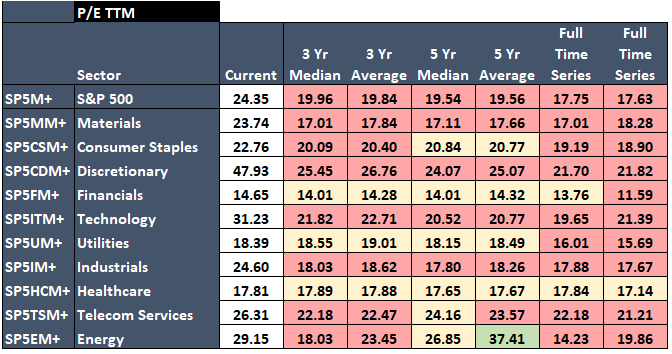
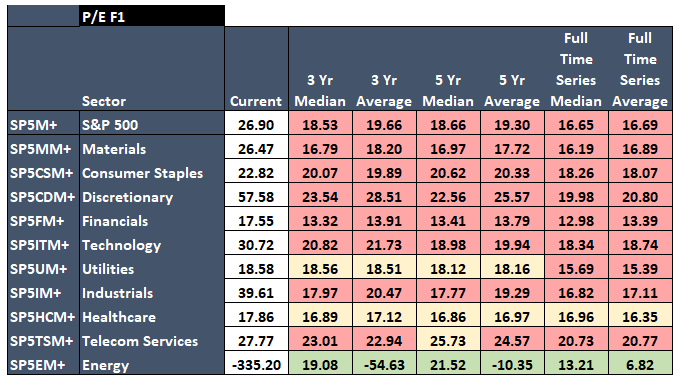
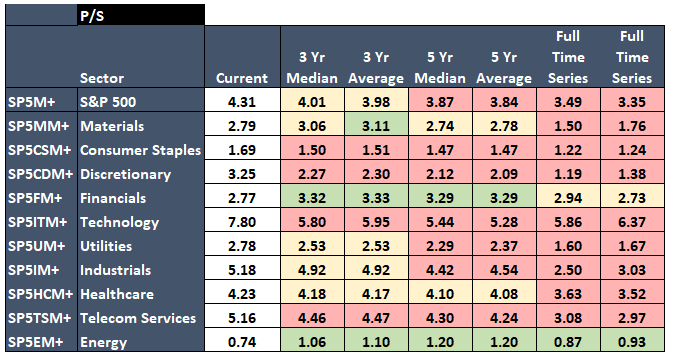
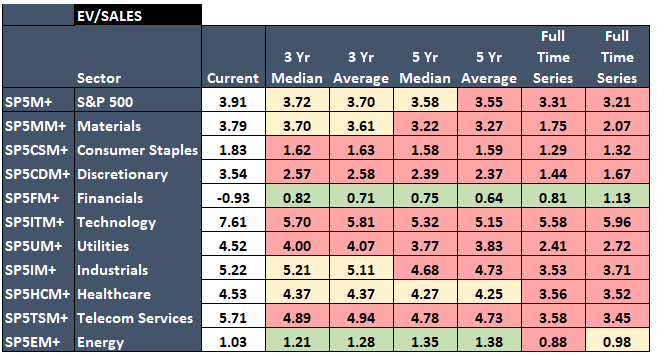
The tables below show various valuation metrics for the S&P 500 and the major sectors. The table compares current valuations to both the 3-, 5- and full-time series “median” and “average” valuations.
What you should immediately notice is that except for Financials and Energy, which have many underlying fundamental problems currently, investors are overpaying on every metric on both a short- and long-term basis.
PEG: Price / Earnings Growth
P/B: Price / Book Value
P/E: Price / Earnings Trailing 12-Months
P/FPE: Price / Earnings Forward 12-Months
P/S: Price / Sales
EV/S: Enterprise Value / Sales
As you can see, there is not a lot of “value” currently in the market. Such is why investors have to begin to “rationalize” valuations to justify “speculative” positioning.
The Risk Of Overpaying
While it is “bullish” to come up with reasons to justify overpaying for assets in the short-term, outcomes are quite different long-term.
No matter how many valuation measures you use, the message remains the same. From current valuation levels, the expected rate of return for investors over the next decade will be low.
There is a large community of individuals who suggest differently, as they make a case as to why this “bull market” can continue for years longer. Unfortunately, any measure of valuation does not support that claim.
Such does not mean that markets will produce single-digit rates of return each year for the next decade. The reality is there will be some tremendous investing years over that period. There will likely also be a couple of tough years in between.
That is the nature of investing. It is just part of the full-market cycle.
The economic cycle is tied closely to demographics, debt, and deficit. If you agree with this premise and the data, then the media’s optimistic views are unlikely.
In our opinion, rationalizing high valuations today will likely lead to disappointing future outcomes.
Disclaimer: Click here to read the full disclaimer.


