
Lower Nominal Wage Growth Than Usual
The difference between the U6 unemployment rate and the U3 unemployment rate, seen in the chart below, measures the percentage of marginally attached workers and workers who are part-time for economic reasons.
(Click on image to enlarge)
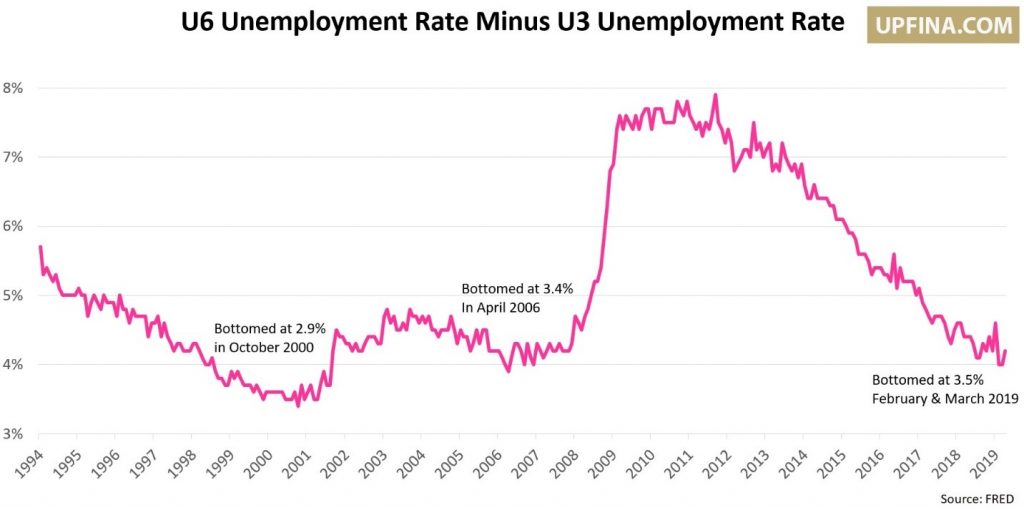
We were motivated to make the chart above because the U6 rate hasn’t moved in 3 months as it is stuck at 7.3%, while the U3 rate recently fell to 3.6% which is a 49 year low. The 0.2% drop in the U3 rate caused the difference between the two to increase to 3.7% from 3.5%.
As you can see, the recent bottom in February and March is just 0.1% above last cycle’s bottom and 0.6% above the previous cycle’s bottom. Avoid hindsight bias when reviewing this chart because it was difficult to determine if the past two bottoms were the end of the cycle at the time. The rate meandered a bit before soaring as the economy weakened. This chart exemplifies the point of how a great jobs market that is weakening is the worst case scenario for stocks and the economy.
At the last bottom in April 2006, average hourly earnings growth for production and non-supervisory workers was 3.94%. It was 3.89% in October 2000. This cycle has had lower wage growth as it was 3.44% and 3.33% in February and March of this year. (It increased 4 basis points in April.) That’s one indication that the labor market isn’t as full as it was then.
Prime Age Population Not Showing A Full Labor Market
The prime age population rate falling from 82.5% to 82.2% in April tells us that the decline in the number of employed people and the decline in the number of people in the labor force wasn’t mainly caused by workers retiring. In October 2000 it was 83.6% and in April 2006 it was 82.8%. Because of the decline in April, if the rate continues increasing at the current pace seen in the past year, it will take 5.78 years to get to the past 3 cycle’s average peak. The big decline increased the difference between the current rate and the average peak as well as lowered the recent pace. This all could easily reverse next month. There have been a few months where this rate has fallen in the midst of its rise which started in September 2015.
Low Wage Growth
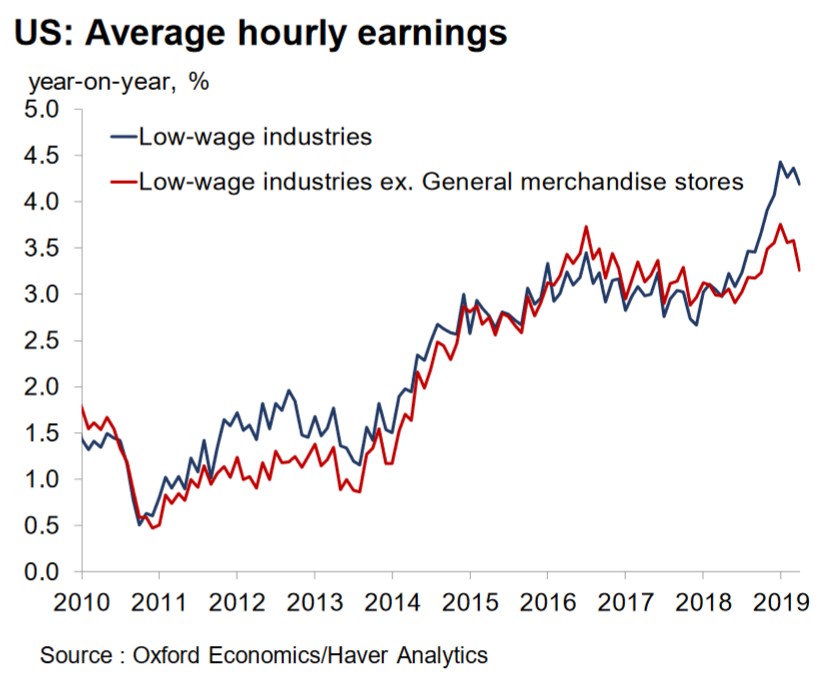
As we’ve highlighted in previous articles, low wage industries have seen accelerating wage growth in the past few months relative to others. Low wage growth is being helped by minimum wage hikes at the state level and because the employment to population ratio for people without a high school diploma is near a historic high. Low wage workers are usually crushed by recessions and outperform at the end of expansions. Keep in mind, that not only does wage growth underperform in recessions, the unemployment rate for low wage workers also spikes higher than it does for mid and high wage workers. It’s tough to get a job and when you get one, the pay growth isn’t great.
General Merchandise Industry’s Effect On Low Wage Growth
One new point we hadn’t previously considered is the effect of general merchandise stores’ wage growth on the calculation of low wage industry growth. As you can see, while low wage growth excluding general merchandise stores is elevated, it’s not nearly as high as the calculation that includes them. The effect general merchandise stores have had on low wage growth has been heightened in the past 12 months.
(Click on image to enlarge)
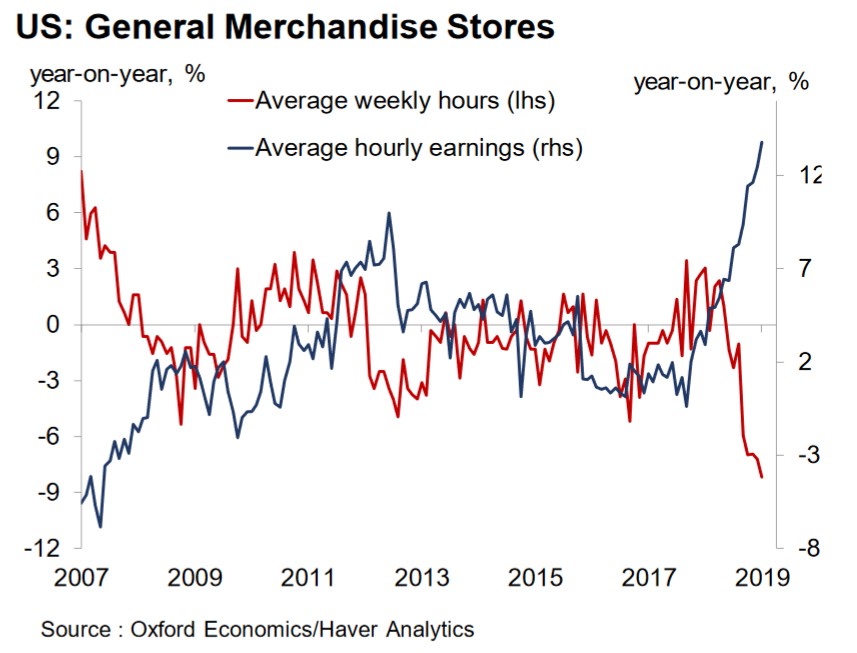
As you can see from the chart below, average hourly earnings growth at general merchandise stores has soared, but weekly hours growth has plummeted. This decline in hours growth is similar to but more pronounced than the decline in hours worked in the overall labor market. This chart is subject to composition bias worthy of noting. The lowest productivity and lowest paying firms in the general merchandise industry, which is shrinking, are laying off the least productive workers first. That explains why average hourly earnings growth went up and hours worked fell. This chart explains why we review weekly earnings growth closer than average hourly earnings growth when reviewing the overall labor market.
(Click on image to enlarge)
MBA Applications Increase Again
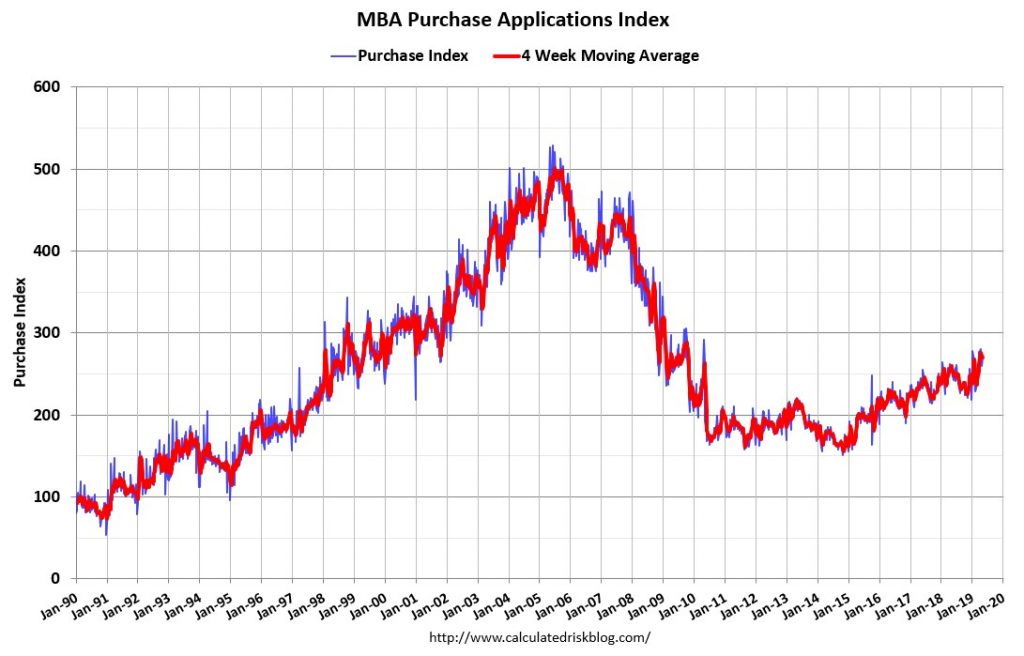
In the week of May 2nd, the 30-year mortgage rate fell from 4.2% to 4.14%. While that specific decline probably isn’t the reason for the mortgage applications growth improvement in the past week, the decline in the past 6 months is the main reason the housing market has stabilized. The MBA applications composite index increased 2.7% weekly on top of -4.3% growth in the week of May 3rd. The purchase index had a growth of 4% on top of -4%. That equates to 5% yearly growth instead of 1% growth. As the chart below shows, purchase applications are near recent highs. 2019’s average growth rate is 3.7%. There have been 15 positive prints and 3 negative yearly growth prints.
(Click on image to enlarge)
Q1 Earnings Season 85% Over
Q1 earnings season was great because the average earnings beat was above average and the Q2 estimate decline was less than average. As the table below shows, the average EPS surprise was 6.17% which beats the 3 year average of 5.26%.
(Click on image to enlarge)
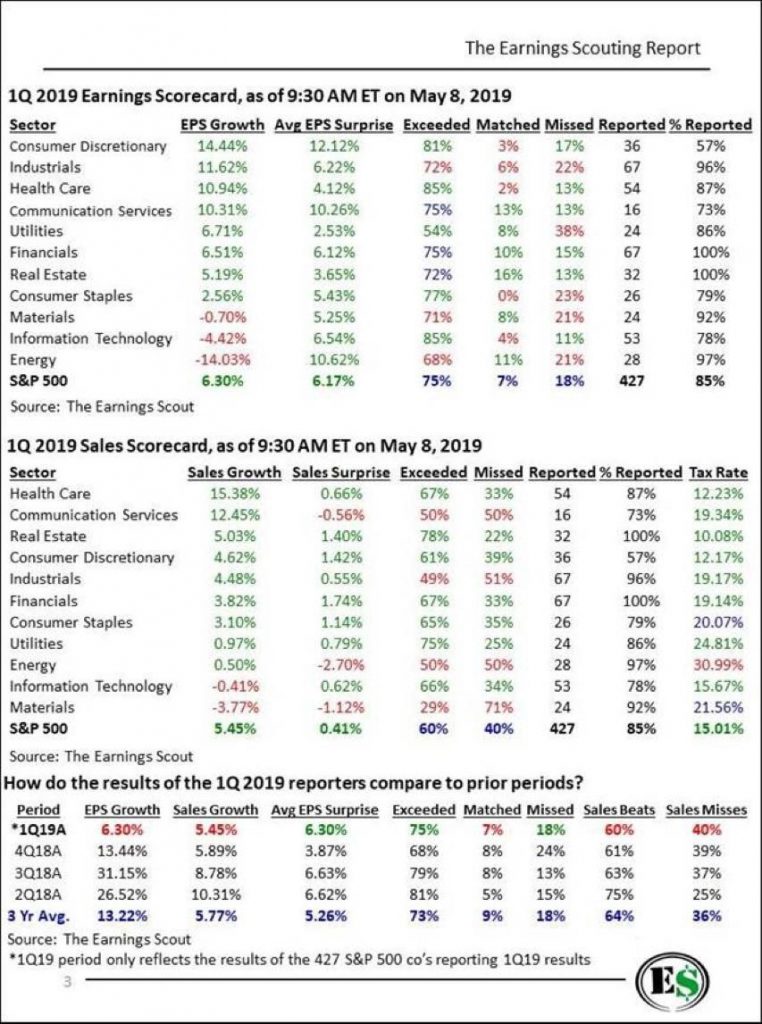
While EPS growth was less than half the 3-year average, it was positive which ends the fears of an earnings recession in the near term. The only issue with earnings season is it’s almost over. Earnings won’t provide much of a catalyst for the overall stock market for the next 2 months. That means investors will focus more on trade worries and economic reports which have been weak. That’s a toxic cocktail which could lead to a correction, depending on how badly negotiations go and how weak economic reports are. To be clear, if economic reports stay weak, Q2 earnings are likely to beat estimates less than expected.
Conclusion
The labor market is full according to the U6 rate minus the U3 rate. However, the prime age labor force participation rate disagrees. Low wage growth is high, but it’s not as high as indicated because the general merchandise store industry is manipulating growth due to composition bias. MBA purchase applications rebounded in early May. Q1 earnings growth was great, but earnings season is now 85% over. That means more focus will be on economic reports which is bad if they continue to be weak.
Disclaimer: Please familiarize yourself with our full disclaimer here.


