
Low Profitability Puts XPO Logistics At A Disadvantage
Stop us if you’ve heard this scenario before: soaring debt, significant shareholder dilution, multiple large acquisitions, and executives paid for stock price performance, all of which results in massive revenue growth with no profits. No we’re not talking about Valeant (VRX) or Perrigo (PRGO), or any prior Danger Zone stocks. We’re talking about XPO Logistics (XPO: $27/share), which looks like another roll up scheme, for the Danger Zone this week.
Acquisitions Boost Revenue While Killing Profits and Diluting Investors
Over the past few years, XPO Logistics has engaged in aggressive acquisitions that have fueled revenue growth upwards of 100% compounded annually over the past five years. These acquisitions, specifically the buyouts of Norbert Dentressangle and of Con-way Freight, which totaled over $6.5 billion, were done with little regard to the economic/cash flow repercussions. As can be seen in Figure 1, XPO Logistics’ economic earnings, the true cash flows of business, have declined from $1 million in 2010 to -$310 million in 2015. See the reconciliation of XPO Logistics’ GAAP net income to economic earnings here.
Figure 1: Revenue Doesn’t Equate To Economic Earnings
(Click on image to enlarge)
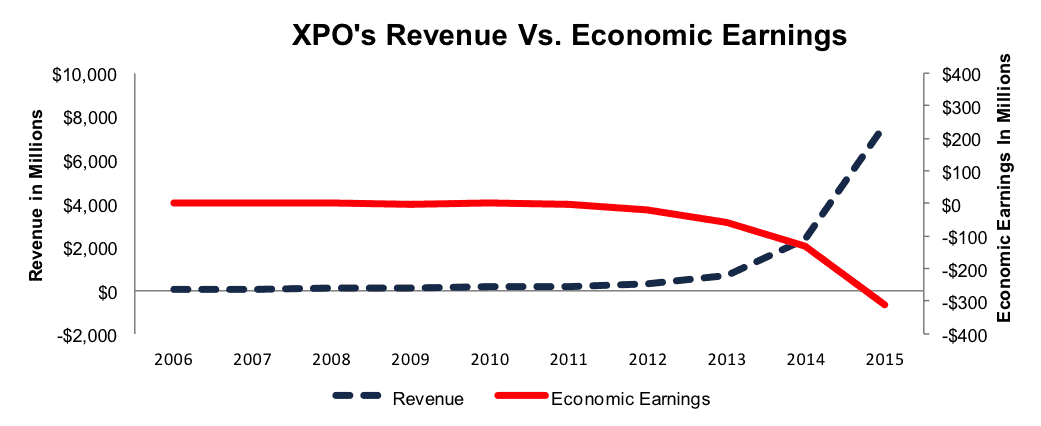
Sources: New Constructs, LLC and company filings
Aside from negative economic earnings, XPO’s return on invested capital (ROIC) has fallen from 12% in 2010 to a bottom quintile 2% over the last twelve months.
Major Dilution: Acquisitions Funded At Expense Of Investors
Adding to the issues, XPO has greatly increased debt and diluted shareholders over this time frame. 2010-2015, XPO’s debt grew over 290% compounded annually to $7.3 billion (238% of market cap). Its shares outstanding grew from 33 million to 110 million, or 27% compounded annually from 2010-2015. Essentially, XPO funded its acquisition-based growth at the expense of shareholders, while deriving no profits.
Shareholder Destructive Acquisitions Driven By Misaligned Executive Compensation
We blame XPO’s executive compensation plan for the acquisitions that dilute shareholders, grow debt and lose money. Apart from cash bonuses, which are tied to meeting “adjusted EBITDA” goals, over 80% of the CEO’s pay and over 50% of other executives’ pay is awarded via long-term incentive restricted stock units (RSUs).
Vesting of these RSU’s is tied directly to stock price and “adjusted cash earnings per share.” Essentially, management has been incentivized to grow XPO’s stock price at almost any cost. $7.5 million in 2015 RSUs vest if XPO trades above $60/share for 20 consecutive days prior to April 2, 2018, or above $86/share for 20 consecutive days prior to September 2, 2020, and the company can meet the cash EPS goals. In 2016, executives were granted $38 million in RSU’s for the 2016-2019 period that vest based upon the achievement of target “adjusted cash flow per share” metrics. Executives were given the green light for on an acquisition spree and as the high-low fallacy shows, executives can increase EPS through value destructive acquisitions, all while profiting for themselves. One other important note about XPO’s executive compensation plan, it’s strictly focused on non-GAAP metrics, an issue we detail below.
You Cannot Pay Your Debtors With Non-GAAP Earnings
Investors only following XPO management’s presentations might believe the company is a high-flying success, especially when it comes to “adjusted EBITDA,” the company’s go-to metric to present its operations. When looking through this noise, the underlying economics of the business reveal a much worse situation per Figure 1. Here are the expenses XPO removes to calculate its non-GAAP metrics, including adjusted EBITDA and adjusted net income:
- Transaction & integration costs
- Foreign currency losses
- Rebranding costs
- Debt commitment fees
- Accelerated amortization
In 2015, XPO Logistics’ non-GAAP net income was a -$37 million, compared to -$246 million GAAP net income and -$310 million economic earnings. Figure 2 shows the discrepancies between GAAP, non-GAAP, adjusted EBITDA, and economic earnings from 2013-2015. We would take a longer look, but adjusted EBITDA and adjusted net income were not used until 2013.
Figure 2: XPO’s Misleading EBITDA Metric
(Click on image to enlarge)
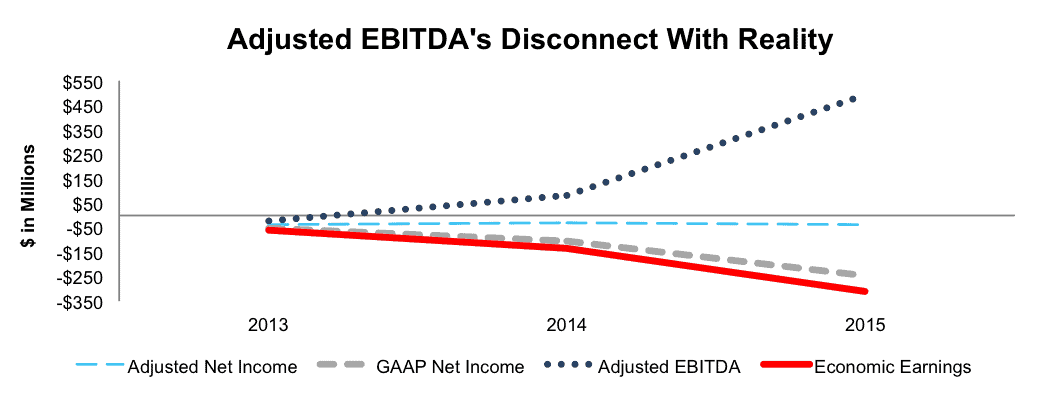
Sources: New Constructs, LLC and company filings
Low Profitability Puts XPO Logistics At A Disadvantage
XPO Logistics operates across many different forms of freight, including full truckload (FTL), less-than-truckload (LTL), global forwarding, supply chain logistics, and last mile delivery for heavy goods. By encompassing so many different aspects of the freight industry, XPO faces numerous competitors. Unfortunately, XPO’s multifaceted approach leaves it operating much less profitably than its competition, including, but not limited to, Landstar System (LSTR), C.H. Robinson Worldwide (CHRW), United Parcel Service (UPS), and FedEx Corporation (FDX). Each of these competitors has a higher ROIC and NOPAT margin than XPO. A lower ROIC and NOPAT margin mean lower pricing flexibility. Lack of pricing flexibility is a big disadvantage in an industry where transport rates can greatly impact purchase decisions and profit margins. See Figure 3 for more details.
Figure 3: XPO’s Profitability Is The Lowest Amongst Peers
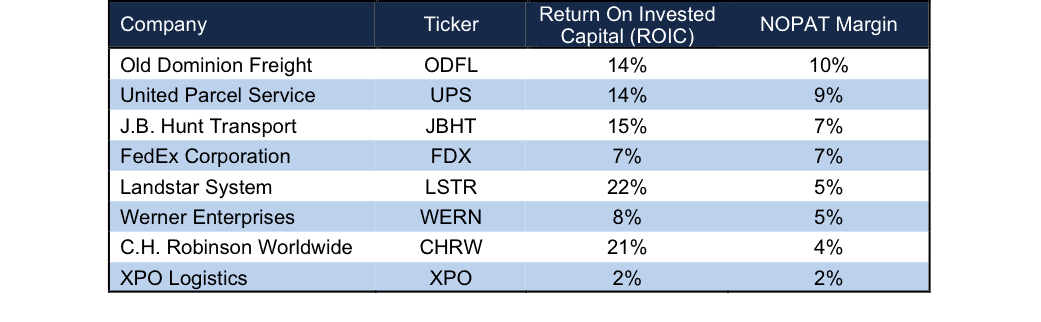
Sources: New Constructs, LLC and company filings
Bull Hopes Rest On Continued Acquisitions
From 2013-2015, XPO grew revenue from less than $1 billion to over $7 billion. For bulls of XPO, these acquisitions were integral in building different facets of XPO’s operations, despite the massive value destroyed. However, such hopes ignore key challenges facing the industry and XPO.
First, the industry is highly competitive, and as e-commerce grows in popularity, freight transportation and the delivery of goods will become even more commoditized. As a result, pricing power will only get weaker for the industry at large. Given how unprofitable XPO is today, it is at a competitive disadvantage in terms of pricing power and will have a harder time with price pressure than its competitors.
Second, demand for XPO services could shrink. In March 2016, Amazon announced it was leasing 20 planes and starting its own air freight service. While there are few firms with as much sway in the retail/ecommerce industry, Amazon taking back control of its logistics chain could be a sign of things to come for the freight industry.
The biggest risk to our thesis, as with all roll-up schemes, is that investors continue to turn a blind eye to the value destruction occurring and, instead, focus on revenue and “adjusted EBITDA” growth. As long as the company can continue this, albeit value destructive, growth, bulls will tout the ability of management to expand the business, find “accretive” deals, and continue believing that profits are right around the corner. In this scenario, the stock price could remain overvalued for some time.
Acquisition Hopes Cannot Justify Valuation
XPO Logistics’ CEO, Brad Jacobs is no stranger to building companies with a takeover endgame. He founded United Waste Systems in 1989, acquired over 250 companies, and then sold to Waste Management (WM) in 1997. Similarly, he entered into a deal to sell United Rentals to a private equity firm in 2007, but the deal fell through amidst the economic collapse in 2008. Could XPO just be another company being built up to ultimately be acquired? If so, XPO has hidden liabilities that make it more expensive than the accounting numbers suggest.
- $1.8 billion in off-balance sheet debt (58% of market cap)
- $716 million in deferred tax liability (23% of market cap)
- $355 million in minority interests (12% of market cap)
- $257 million in underfunded pensions (8% of market cap)
- $23 million in outstanding employee stock options (<1% of market cap)
After adjusting for these hidden liabilities (which add up to 102% of market cap), we can model multiple purchase price scenarios. Unfortunately for investors, only in the best of scenarios does XPO warrant a takeover at a price higher than today’s.
To highlight how overvalued XPO is, Figures 4 and 5 show what we think UPS should pay for XPO to ensure the deal is truly accretive to UPS’s shareholder value. Each implied price is based on a ‘goal ROIC’ assuming different levels of revenue growth. We chose to assess the economic value of XPO after 5 years at three different levels of revenue growth: 15%, 18% and 23%. These levels were chosen to represent reasonable scenarios for revenue growth over the next five years assuming that UPS would put a stop to the value-destroying acquisitions.
There are limits on how much UPS should pay for XPO to earn a proper return, given the NOPAT or cash flows being acquired. For each of the scenarios, we assume XPO achieves a 4% NOPAT margin post acquisition. This margin is more than double XPO’s current margin (1.7%), but lower than UPS’s 8% margin, which is higher due to United Parcel Services’ highly profitable domestic and international package delivery segment. We give XPO a slight increase in margins due to UPS’s ability to cross sell within its larger Logistics segment and aggressively attract/retain customers using resources from UPS’s profitable business lines.
Figure 4: Implied Acquisition Prices For UPS To Achieve 6% ROIC

Sources: New Constructs, LLC and company filings.
The first “goal ROIC” is UPS’s weighted average cost of capital (WACC) or 6%. Figure 4 shows the prices UPS should pay for XPO assuming different levels of revenue growth achieved post acquisition. Only if XPO can continue growing revenue at double digits each year for the next five years and earn a 4% NOPAT margin is the firm worth more than its current share price of $27/share. We include this scenario to provide a “best-case” view. Regardless, any deal that only achieves a 6% ROIC would be value neutral, as the return on the deal would equal UPS’s WACC.
Figure 5: Implied Acquisition Prices For UPS To Achieve 10% ROIC

Sources: New Constructs, LLC and company filings.
Figure 5 shows the next “goal ROIC” of 8%, which is UPS’s current ROIC. This deal would be truly accretive to shareholders as it would maintain UPS’s ROIC. Any purchase price below this would actually increase ROIC, which is directly correlated to increasing valuation. In the best case growth scenario, the most UPS should pay for XPO is $18/share (33% downside).
Without A Takeover, Organic Growth Expectations Are Unrealistic
To justify its current stock price ($27/share) via organic growth, XPO must grow NOPAT by 28% compounded annually for 19 years. For context, in this scenario XPO would be generating over $800 billion in revenue 19 years from now, or greater than the entire U.S. trucking industry in 2015. A more realistic, but still optimistic scenario, given that XPO focuses on organic growth and ditches costly acquisitions assumes XPO can grow NOPAT by 19% compounded annually for the next decade, the stock is worth only $4/share today – an 85% downside.
Catalyst: Unraveling of The Roll-Up Scheme Will Sink Shares
XPO and other firms that use acquisitions to significantly grow become reliant upon acquisitions to meet not only internal goals for compensation, but also external expectations. However, this roll-up strategy cannot go on forever. When they end, stock prices can crash rather violently especially when there has been significant shareholder value destruction. As we saw with Valeant, when the government and analysts alike began asking questions about its business, the economics of the business were revealed to be rather hollow. XPO is in a similar predicament. While its acquisitions can create a rosy, superficial picture of the business, the economics of the company are in decline.
XPO may have entered a vicious cycle in which it must find acquisitions to meet growth expectations, but in doing these deals, management is only putting further strain on the fundamentals of the business. Banks don’t have unlimited appetite for risk, and there may come a time when XPO is no longer a company to whom banks will be willing to lend. In either scenario, funding is harder to get, acquisitions become harder to find, and expectations become harder to meet. While we can’t predict when this house of cards will fall, we do know this roll-up practice cannot go on forever. We’ve said it before, and we’ll say it again, non-GAAP earnings, or “adjusted EBITDA” can’t make the cash payments required to run a company. Look for an earnings miss, or multiple misses, to reveal that the picture being portrayed by XPO management is not as rosy as they’d like you to believe.
Insider Sales Rather Low But Short Interest Is High
Over the past 12 months 5.6 million shares have been purchased and 107,000 shares have been sold for a net effect of 5.5 million insider shares purchased. These purchases represent 5% of shares outstanding. Additionally, there are 16.7 million shares sold short, or just over 15% of shares outstanding.
Impact of Footnotes Adjustments and Forensic Accounting
In order to derive the true recurring cash flows, an accurate invested capital, and a real shareholder value, we made the following adjustments to XPO Logistics’ 2015 10-K:
Income Statement: we made $785 million of adjustments with a net effect of removing $368 million in non-operating expenses (5% of revenue). We removed $577 million related to non-operating expenses and $208 million related to non-operating income. See all adjustments made to XPO’s income statement here.
Balance Sheet: we made $7.4 billion of adjustments to calculate invested capital with a net decrease of $3.1 billion. The most notable adjustment was $3.8 billion (38% of net assets) related to midyear acquisitions. See all adjustments to XPO’s balance sheet here.
Valuation: we made $8.8 billion of adjustments with a net effect of decreasing shareholder value by $8.8 billion. There were no adjustments that increased shareholder value. One of the largest adjustments was the removal of $1.8 billion (61% of market cap) due to off-balance-sheet operating leases.
Dangerous Funds That Hold XPO
The following funds receive our Dangerous-or-worse rating and allocate significantly to XPO Logistics.
Disclosure: New Construct Staff receive no compensation to write about any specific stock, sector or theme.


