Long Term Technical Analysis Of Apple (AAPL)
Long Term Technical Analysis of Apple (AAPL)
Apple (AAPL)
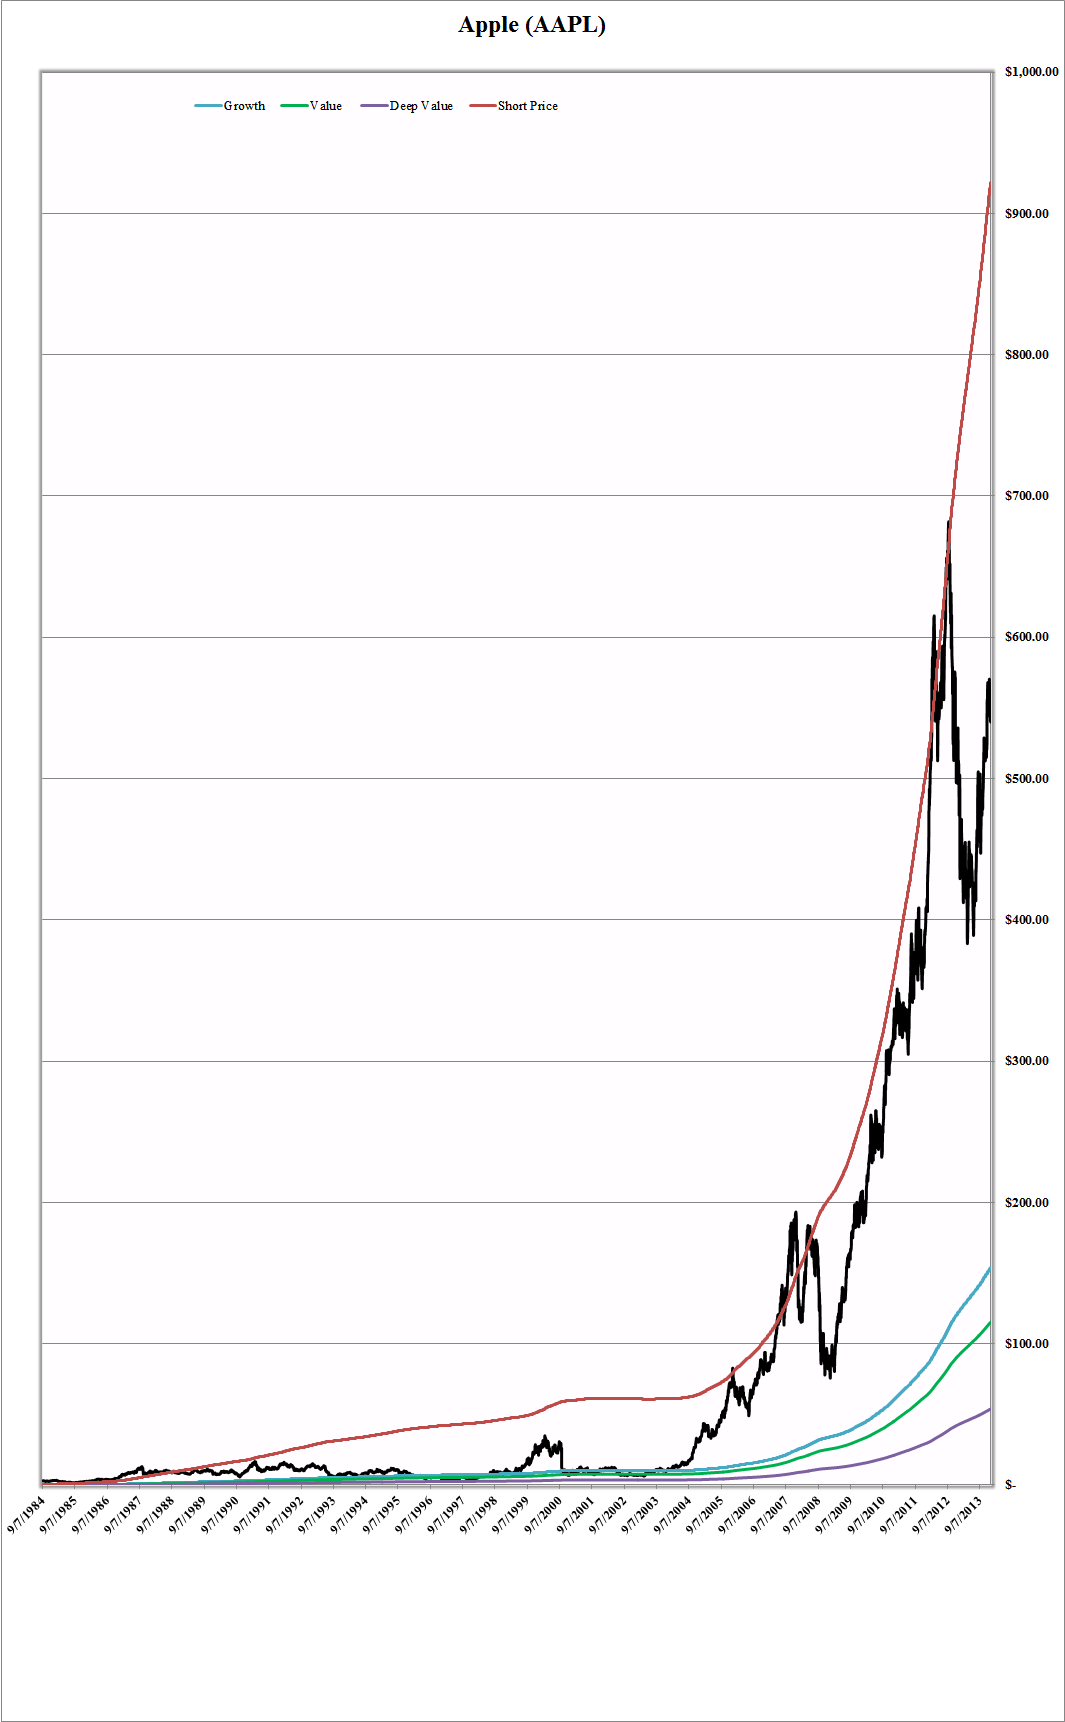
In this analysis of Apple, we present a primer on how to short stocks using our SIA system. We have also made some adjustments to two of the titles in the chart, to make our concepts easier to understand. We have changed "Low Growth" to "Value" and "Negative Growth" to "Deep Value." Every company that is publicly traded goes through various phases throughout its life cycle and has prosperous times as well as challenging times. Apple, for example, had some rough times from 1993-2003 and was clearly both a "value" and "deep value" play at the time. From 2004 to today, it has been a growth story. When a company breaks above its growth line, it enters what we call "the zone," which is the gap between the growth and short price. The short or sell price is equal to six times a company's SIA or growth number. Through a great deal of back testing we have found that six times a company's SIA (3650 trading day moving average) to be not just a good sell price for growth investors, but may also be a great time to short the stock.
The chart illustrates that on two separate occasions, it would have been a good time to short Apple: 1) from 2007 to 2009 (when it broke above its short line), and 2) from 2012 to 2013. Each time, you would have been down on your short initially but eventually if you held, you would have made a killing each time. Currently, Apple is trading in the sweet spot ($540/share), comfortably in between the growth line ($153) and the short line ($922) where $922+$153 = $1,075/2 =$537.50.
None.


