
Kingsway Financial Services - Strong Buy Signals
Summary
- 100% technical buy signals.
- 17 new highs and up 10.71% in the last month.
- 57.90+ Weighted Alpha.
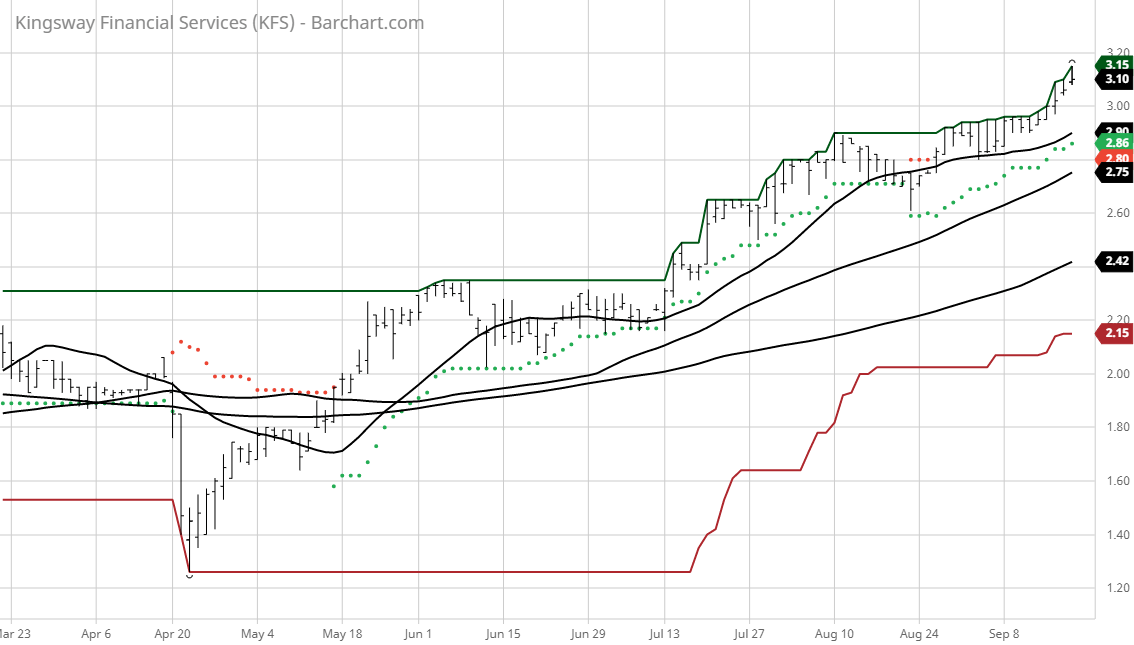
The Barchart Chart of the Day belongs to the extended warranty company Kingsway Financial Services (NYSE: KFS). I found the stock by sorting Barchart's Top Stocks to Own list first by the most frequent number of new highs in the last month, then used the Flipchart feature to review the charts for consistent price appreciation. Since the Trend Spotter signaled a buy in 8/26 the stock gained 9.53%.
Kingsway Financial Services Inc., through its subsidiaries, engages in the extended warranty and leased real estate business. It operates through two segments, Extended Warranty and Leased Real Estate. The Extended Warranty segment markets and administers vehicle service agreements and related products for new and used automobiles. This segment also markets and distributes warranty products to manufacturers, distributors, and installers of heating, ventilation and air conditioning, standby generator, commercial LED lighting, and refrigeration equipment; and equipment breakdown and maintenance support services to companies. The Leased Real Estate segment owns a parcel of real property consisting of approximately 192 acres located in the State of Texas. The company offers its products and services to credit unions, consumers, businesses, and homebuilders. Kingsway Financial Services Inc. was founded in 1989 and is based in Itasca, Illinois.
(Click on image to enlarge)
Barchart's Opinion Trading systems are listed below. Please note that the Barchart Opinion indicators are updated live during the session every 10 minutes and can therefore change during the day as the market fluctuates. The indicator numbers shown below therefore may not match what you see live on the Barchart.com website when you read this report.
Barchart technical indicators:
- 100% technical buy signals
- 57.90+ Weighted Alpha
- 21.09% gain in the last year
- Trend Spotter buy signal
- Above its 20, 50 and 100 day moving averages
- 17 new highs and up 10.71% in the last month
- Relative Strength Index 73.18
- Technical support level at 3.07
- Recently traded at 3.10 with a 50 day moving average of 275
Fundamental factors:
- Market Cap $69 million
- Earnings estimated to increase at an annual rate of 10.00% for the next 5 years
- The individual investors following the stock on Motley Fool voted 36 to 16 that the stock will beat the market
- 554 investors are monitoring the stock on Seeking Alpha
Disclosure: None.


