
KB Home Reverses Historic Post-Earnings Gain And Delivers A Buying Opportunity
KB Home (KBH) reported earnings on January 10, 2018. The reaction the next day was outright startling. The stock gapped up and did not stop rallying until it finished with a 12.3% gain and a new 10 1/2 year high.
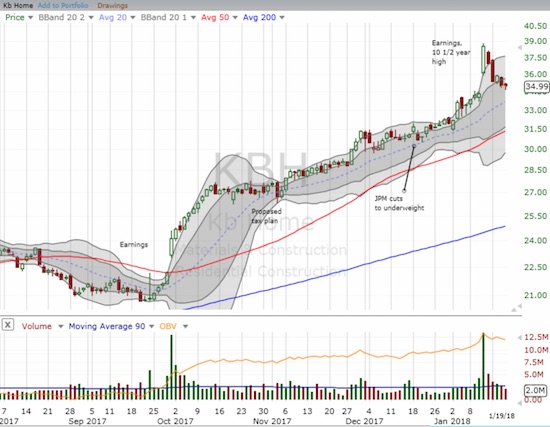
Source: FreeStockCharts.com
Post-earnings, KB Home (KBH) gapped up to a 10 1/2 year high with a 12.3% gain. Sellers regained control after that and have almost closed the entire gap. I was so taken aback that I checked on the historical data to get some context. It turns out KBH’s post-earnings gain was its fourth largest since at least 1997. Moreover, the 42.4% gain between earnings – since the close after September, 2017 earnings to the close before January, 2018 earnings – was the sixth largest since at least 1997. Combined, KBH’s one quarter earnings performance was truly historic and one of the strongest in recent years.
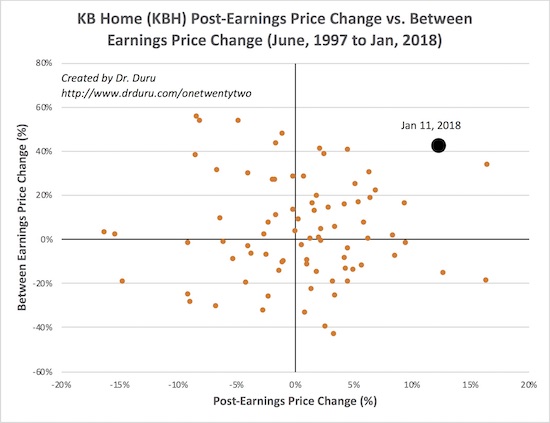
Source for price data: Yahoo Finance, Source for earnings dates: Briefing.com
Download underlying spreadsheet here.
The post-earnings price action for KB Home (KBH) was historic.
Given this historic response, I thought KBH delivered historic and outstanding earnings performance. While indeed strong, KBH basically hit its guidance with a little room to spare. The market’s reaction was like a late recognition that KBH would hit its goals. Management provided strong but reasonably incremental forward guidance for the coming year. In other words, KBH has returned to the good graces of investors as a consistent earnings performer. This time around, the trading action looks like a buyer’s panic in the face of this acknowledged reality. Yet, the buying panic exhausted itself in the short-term as sellers and profit-takers were able to gain control and nearly reverse the entire post-earnings gain.
I used this pullback as an opportunity to make a fresh trade on KBH. I assumed that the monster performance in the past quarter effectively soaked up much of the short-term buying interest in KBH. So, I purchased a calendar spread going short February calls and long April calls. I expect the February calls to expire worthless and thus pay for a good portion of the longer-term play that I want to make going into the Spring selling season and to make a play on the seasonally strong period for home builders in general. If KBH sells off past the gap and retests the uptrending support at its 20-day moving average (DMA), I may start adding shares to the trade with an upside price target around the last high.
Despite the 10 1/2 year high and preceding run-up, KBH is STILL relatively cheap, especially when compared to the S&P 500 and even other home builders. Based onYahoo Finance:
- Trailing P/E: 18.91
- Forward P/E: 11.40
- Price/Sales: 0.69
- Price/Book: 1.58
Other home builders have surpassed 2x book and are beyond 1x book. Home builders usually hit 1x book during downturns and troughs in the market cycle. Trading below 1x book is typically a sign of deep skepticism about the business. Indeed, KBH skeptics still abound with 21.8% of stock’s float sold short.
Here is a summary of the results that most caught my attention for KBH taken from its press release and the Q&A session in the transcript of the conference call from Seeking Alpha.
Annual Revenues
- Housing revenues gained 21% to $4.34B.
- Home deliveries gained 11% to 10,909.
Annual profits, margins, and cash flow
- Homebuilding operating income gained 86.0% to $283.4M
- Homebuilding operating income margin (excluding inventory-related charges) gained 140 basis points to 7.1%.
- Net income increased 71.0% to $180.6M, or +65.2% to $1.85 per diluted share
- Net operating cash flow increased 172% to $513M. This metric was not explicitly reported in the fourth quarter of 2016, but it was likely negative given net cash and equivalents only increased from $559.0M in 2015 to $592.1M in 2016.
KBH described the drivers of the improvement in gross margins: “…deliveries from newer, higher margin communities, favorable regional mix and fixed cost leverage on a larger revenue base.” In other words, great performance from California in particular.
Investments
- $1.52 invested in land acquisition and development for the year ended November 30, 2017.
Orders per community and order value
KBH’s orders per community increased slightly Q4 to 3.4/month.
Regionally, KBH had mixed order performance on an annual basis. The West made incremental gains. The Southwest soared. The Central and Southeast regions took steps back. The West was 46% of KBH’s net order value in 2017. The Central region was 28%, and the Southwest was 13%.
- West: 28.8% gain in net order value on a 11.9% gain in net orders versus a 27.4% gain in net order value on a 24.8% gain in net orders in 2016.
- Southwest: 24.6% gain in net order value on a 20.6% gain in net orders versus a 11.4% gain in net order value on a 10.4% gain in net orders in 2016. (Las Vegas was particularly strong).
- Central: 7.9% gain in net order value on a 1.5% gain in net orders versus a 14.0% gain in net order value on a 9.8% gain in net orders in 2016.
- Southeast: 11.2% drop in net order value on a 9.7% drop in net orders versus a 0.1% drop in net order value on a 4.5% drop in net orders in 2016.
For the Southeast, KBH pointed out that the small year-over-year gain in net orders in the fourth quarter was the first such gain in “many quarters.” KBH reinvested more heavily in the Southeast in 2017.
Tax reform impact
KBH stuck to the updated narrative from home builders about tax reform: it will be a net positive for its business and customers. KBH concluded that a “majority” of individual taxpayers will see lower taxes, observe more jobs in the economy, experience higher confidence, and on balance express higher demand for homes. Management cited reports estimating 80% to 85% of taxpayers will get a lower tax rate. First-time buyers in particular will have a little more money in their pockets.
For KBH, “a lower tax rate should drive higher earnings, returns and cash flow over the longer term.” Jeff Kaminski, KBH EVP and CFO, declared: “…I don’t have any hesitation saying that whatsoever on the tax side. I think it’s going to be, across the board, positive, but that’s again, my opinion.”
Guidance
- Homebuilding operating income margin (excluding inventory-related charges) – Q1 2018: 4.3% to 4.7%. Full year 2018: 7.2% to 7.7% which is above prior guidance.
- Housing gross profit margin (excluding inventory-related charges) – Q1 2018: 16.0% to 16.5%, an increase of 90 to 140 basis points year-over-year. Full year 2018: 17.2% to 17.7%, an increase of 30 to 80 basis points year-over-year.
KBH explained its incrementally higher expectations given “…some nice trends throughout the business. Some of the new communities that we’ve opened recently, performing pretty well in accordance with our expectations, and we just gained a little bit more confidence on the back half of the year.”
Overall, KBH expects to continue meeting (or exceeding) the targets it laid out in its “Returns-Focused Growth Plan.” The company has successfully completed year one of that plan.
Disclosure: long KBH calendar spread
Follow Dr. Duru’s commentary on financial markets via more


