
Just For Fun: 2021 Stock Market Projection

The State of the Market
Well, it's that time of year again. The time when just about every market analyst on the planet peers into their crystal ball to conjure up a prognostication about what will happen to the market in the coming year.
To be sure, I don't employ predictions, outlooks, opinions, or gut hunches in my approach to managing money. As long-time readers are likely aware, I prefer to utilize a pragmatic, rules-guided methodology with as much modeling as I can get my hands on.
My overarching goal is to "get it mostly right, most of the time," meaning that I strive to keep portfolios on the proper side of the prevailing market cycles. In short, I want to "make hay while the sun shines" and then try to "lose the least amount possible" when the big storms hit the corner of Broad and Wall.
However, since I do have access to a market model or two, I decided to join in the prognostication fun last year. Labeling the exercise as "just for fun," I started with what I believe are the stock market's primary driving forces (the economy, earnings, monetary conditions, inflation, and valuations), added in some Presidential Election Cycle work, and then tossed in a couple of my favorite market models. I then averaged the historical returns of the S&P 500 for the current readings of each model.
When the numbers were crunched, I came up with a 2020 projection of 3713. On Tuesday of last week, when I was asked about my 2020 modeling, which, truth be told, I had forgotten about, the projection was looking pretty good. As of Friday's close, I'm off by 50 points or 1.36%. But with 13-ish trading days left in the year, I figure there's still time for the bulls to make me a hero!
Assuming the market doesn't tank or spike too high in the final days of the year, I'm going to call the 2020 projection a win - with a hearty chuckle, of course.
With a streak of one-in-a-row going, I thought it might be interesting to have a go at 2021. So, below is a summary of my analysis, with the projections using the current readings of my models highlighted in yellow. The bottom line is the current state of the models suggests a return of 9.2% for the S&P 500 next year.
From Friday's close, this would put the S&P at around 4,000 at this time next year. Fingers crossed.
(Click on image to enlarge)
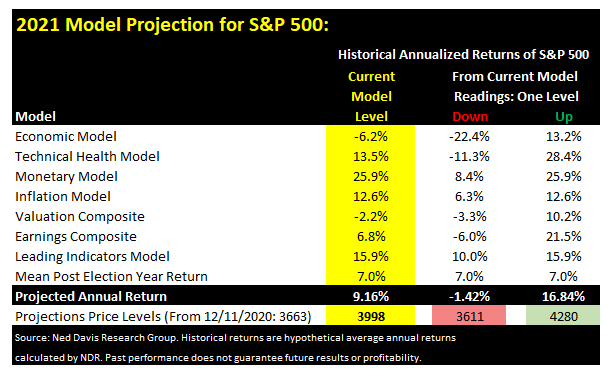
The next two columns on the chart explore the scenarios where the models all move down and up one rung from their current readings. Using this approach, I can project that the downside risk to the market would be a loss of 1.4% while the upside opportunity should all the models move up one level from where they are now, would be a gain of 16.8%.
So, there you have it. Do with this what you may, but I for one am likely to forget having done such an exercise until this time next year.
Now let's turn to the state of my favorite big-picture market models...
The Big-Picture Market Models
There are no obvious changes to report on the Primary Cycle board this week. However, I will note that (1) our Intermediate-Term Market Model slipped from positive to moderately positive, and (2) The Fundamental Factors composite (included on Mondays going forward - see below) also pulled back a bit. But as I've been opining lately, the board continues to favor the bulls and as such, I believe a "buy the dips" strategy remains appropriate.
(Click on image to enlarge)
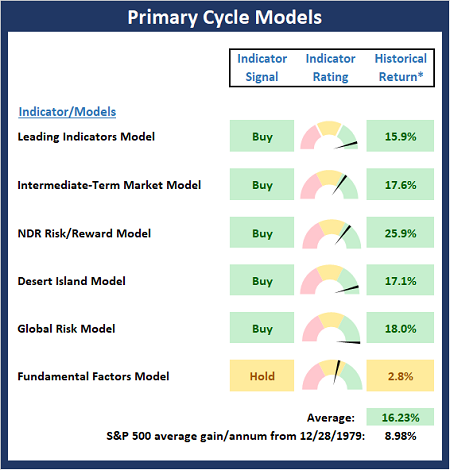
* Source: Ned Davis Research (NDR) as of the date of publication. Historical returns are hypothetical average annual performances calculated by NDR.
Fundamental Factor Models
While the market appears to be looking ahead to "shots in arms" and a return to economic normalcy, this indicator board reflects a weakening in the fundamental factors as both the Earnings Composite and Valuation Composite Models flashing red and the Economic Composite slipping to neutral. The good news is that Monetary conditions continue to be supportive and inflation does not appear to be a problem.
(Click on image to enlarge)
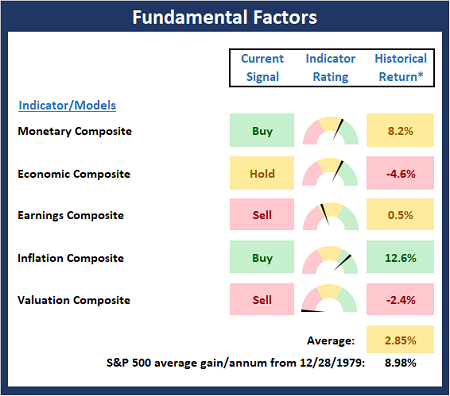
* Source: Ned Davis Research (NDR) as of the date of publication. Historical returns are hypothetical average annual performances calculated by NDR.
Reviewing "Primary" Cycle History
While I don't often make portfolio adjustments based on the long-term trends in the stock market (aka the "primary cycles"), I have found over the years that checking in on state of the cycles and the weekly/monthly charts helps to keep the big-picture in perspective.
(Click on image to enlarge)
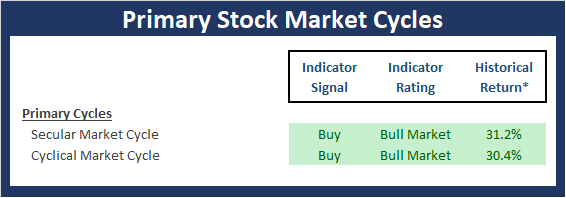
* Source: Ned Davis Research (NDR) as of the date of publication. Historical returns are hypothetical average annual performances calculated by NDR.
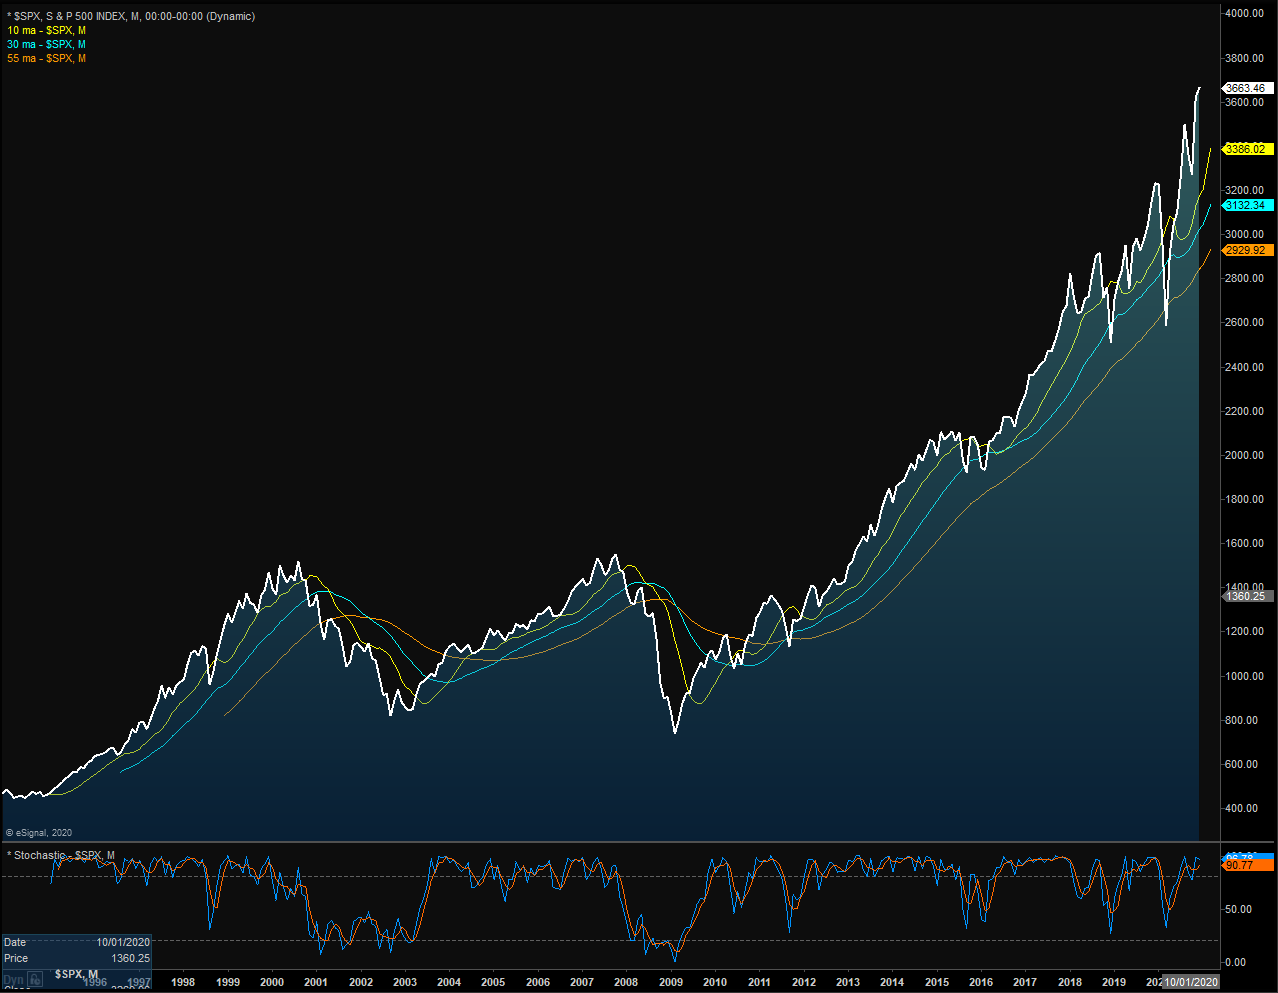
The Secular Market Cycle
Below is a monthly chart of the S&P 500 Index illustrating the current cycle, which we estimate began on March 9, 2009.
S&P 500 - Monthly
(Click on image to enlarge)
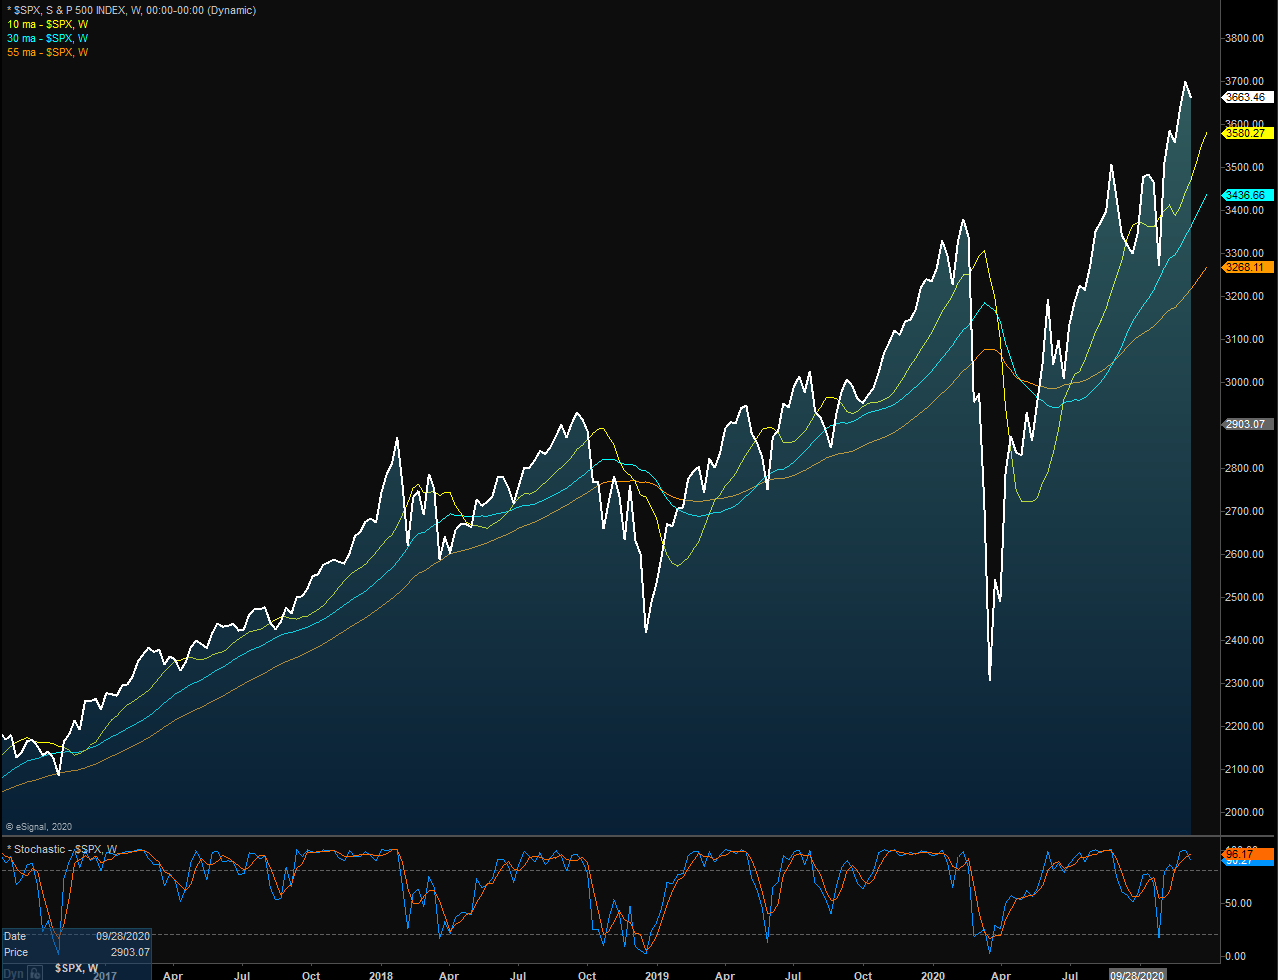
The Cyclical Market Cycle
Below is a weekly chart of the S&P 500 illustrating the current cycle, which we estimate began on March 24, 2020.
S&P 500 - Weekly
(Click on image to enlarge)
The opinions and forecasts expressed herein are those of Mr. David Moenning and may not actually come to pass. Mr. Moenning's opinions and viewpoints regarding the future of the markets should ...
more

