
JPMorgan: Massive Short Squeeze Risks Hawkish Fed "U-Turn"
Just three weeks ago, when the S&P was on the verge of a bear market down nearly 20% from its Sept. 20 all-time highs, JPMorgan provided a simple explanation for the relentless selling pressure: widespread institutional capitulation as deleveraging coupled with margin calls forced hedge and mutual funds to dump exposure and hit virtually any bid in a panic scramble to meet a surge in year-end redemption requests.
As JPM's strategist Nikolaos Panigirtzoglou noted then, extrapolating spec positions to capture the latest open interest changes - the red dots in the chart below -showed a reading that was not far from the previous capitulation levels of January/February 2016.
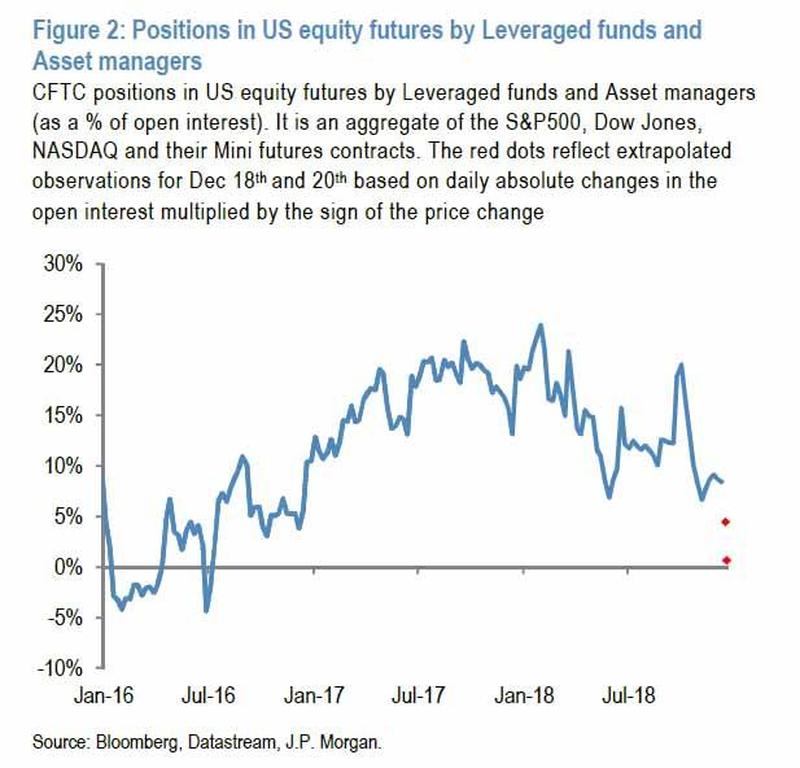
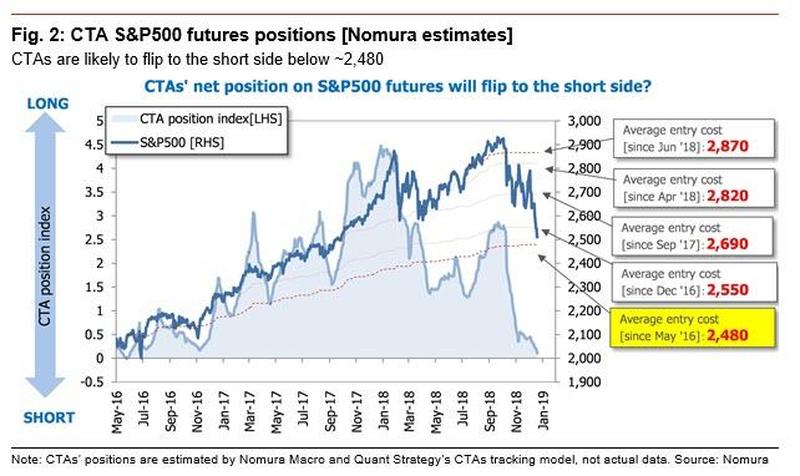
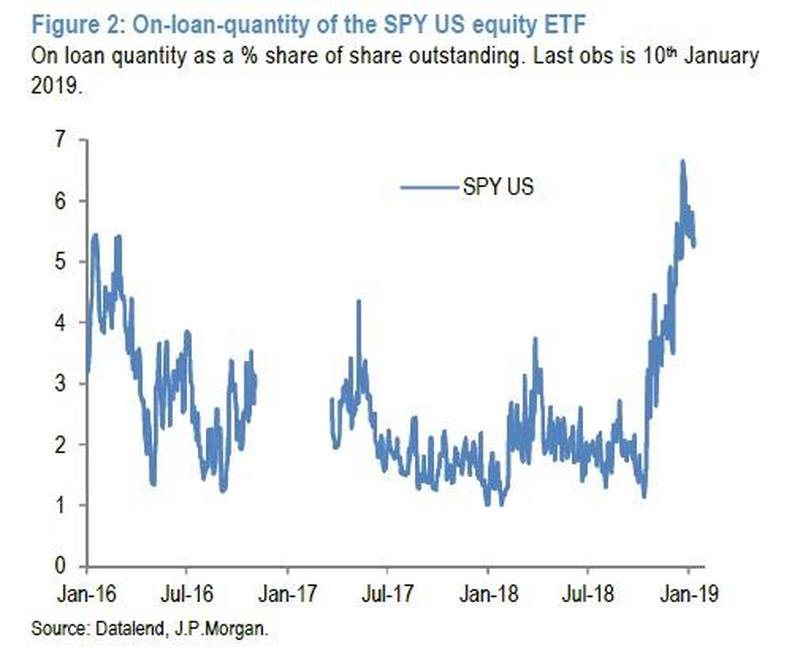
Additionally, the short interest on the SPY - the biggest equity ETF used by institutional investors to express equity views - had jumped to the levels previously seen also during the capitulation episode of January/February 2016. This happened just as momentum chasers and trend followers such as CTAs had finally flipped short for the first time in three years in mid-December.
What was notable about these observations is that according to Panagirtzoglou, this widespread capitulation was "creating a window of opportunity for equity markets into Q1 assuming the Fed reacts to market stress and skips the March meeting" with one caveat:"beyond March, a much bigger dovish shift would be required by the Fed to unwind the inversion at the front end of the US yield curve" something we noted earlier. And, as the JPM strategist adds, "if such dovish shift does not materialize and the yield curve inversion fails to improve, any equity rally in Q1 would most likely be short-lived."
Well, Panagirtzoglou was spot on, because just two weeks later, Chair Powell indeed made a surprising dovish reversal "responding to market stress" as the S&P hit the "Powell Put" level of just above 2,300 which was later confirmed by the FOMC's December Minutes, which in turn sparked the biggest market rally in years as traders scrambled from one extreme to another and in the last week, the capitulation was clearly over and was replaced by manic BTFD euphoria as investors bought a little bit of everything including international equity funds ($3.8bn), government bonds ($3.6bn), EM bonds ($2.4bn), EM stocks ($2.4bn), and HY bonds ($1.5bn) (even as they still sold financial stocks ($1.5bn), IG bonds ($1.4bn), and tech stocks ($0.6bn).
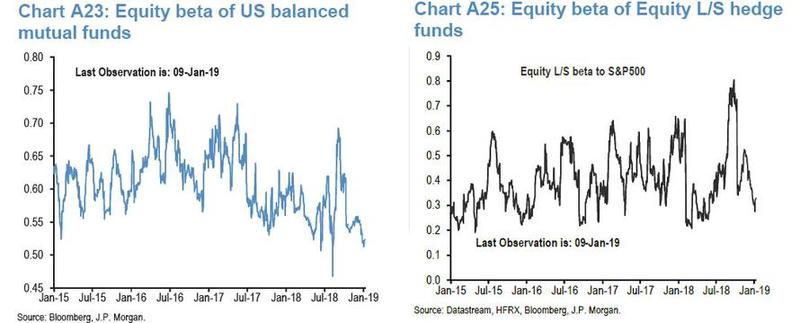
Still, despite this rush into risk assets, in his latest Flows and Liquidity, Panagirtzoglou writes that the signs of capitulation which he discussed on Dec 21, "are largely still in place as indicated by the still low level of our equity betas... These equity betas include systematic traders such as risk parity funds and momentum traders such as CTAs."
Meanwhile, as we predicted would happen, CTAs - which turned net short for the first time in years in mid/late December are now in short covering mode according to JPMorgan.
It's not just the quants who were forced to cover: as JPM notes, the short interest on the SPY has finally started retrenching from the very high/capitulation levels seen at the end of last month, also suggesting sharp short covering by institutional and retail investors. Indeed, looking at the chart below suggest that if indeed the short squeeze has begun, it will have a long way to go before it reaches the levels from late September.
So what does all of this imply for risk assets?
Well, just as JPM correctly predicted that capitulation would be bullish for stocks - the S&P 500 indeed jumped 10% from December 24 - so the risk now is that an overextended reaction in the opposite direction as short covering continues and equity markets recover, leads to the possibility that the Fed makes a u-turn and becomes hawkish again.
According to JPMorgan, "this could indeed be a major risk for equity markets into Q2."
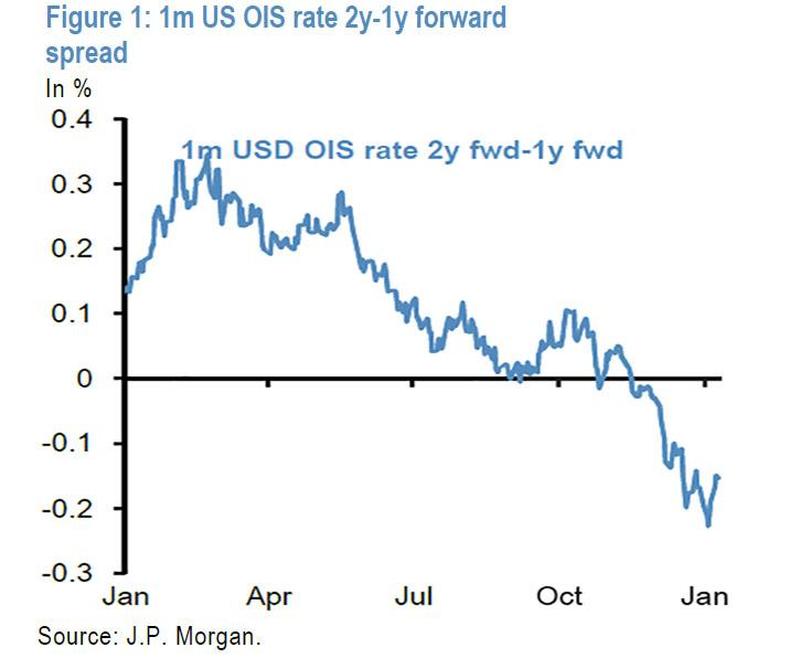
Finally, how to know if the market is expecting such a reversal? The same way the market predicted the sharp tightening in the fall: the 1m US OIS rate 2y-1y forward spread, which rebounded notably in the past two weeks.
Here is Panagirtzoglou summary:
"If such a U-turn happens and if markets see a risk that this u-turn is a policy mistake, JPMorgan predicts that it will likely show up early enough in the 1m US OIS rate 2y-1y forward spread of Figure 1 which would deteriorate and turn more negative again."
So, as the JPM strategist concludes,monitoring this variable going forward is critical to gause whether the Fed Put was indeed triggered, or if the recent surge in the market means that the Fed is about to turn hawkish once again.
Disclosure: Copyright ©2009-2018 ZeroHedge.com/ABC Media, LTD; All Rights Reserved. Zero Hedge is intended for Mature Audiences. Familiarize yourself with our legal and use policies every time ...
more

