

Image Source: Unsplash
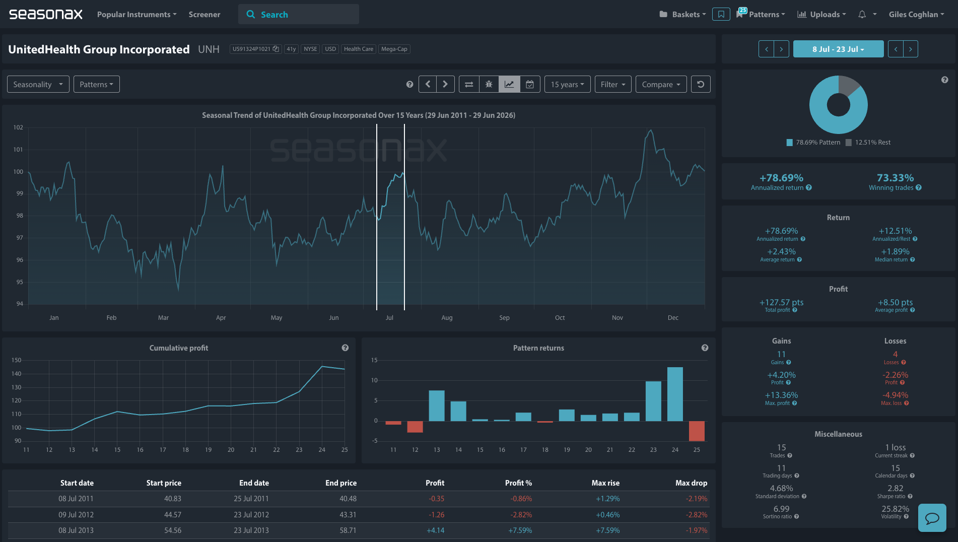
Johnson and Johnson is coming into a strong seasonal pattern now with an average return of nearly 5%. From March 01 through to May 16 share prices have gained 85% of the time over the last 20 years.
The largest gain has been an impressive 16.97% in 2009 and the maximum drop has been a relatively mild 1.73% in 2018. Given how few falls there have been in the share price over the last few years is this a great seasonal pattern to go for this March?
Watch out though as the maximum drop column shows that Johnson and Johnson's shares still had a large drawdown with falls of nearly 8% in 2004, 5% in 2011, and over 20% in the exceptional COVID year of 2020. Check out the video below for more details! The major trade risk here is that the strong seasonals don’t necessarily repeat themselves again this year.
Video Length: 00:01:38
More By This Author:
Gold To Move Over 1.5% On Thursday?Salesforce Slide?
Nvidia And AI Hype

Comments
Log in or sign up to join the conversation.