

Image Source: Pexels
Whether the stock market is trending higher or lower, or even trading sideways, I’ve always found it helpful to watch the equal weight indices for insights about market breadth and market health.
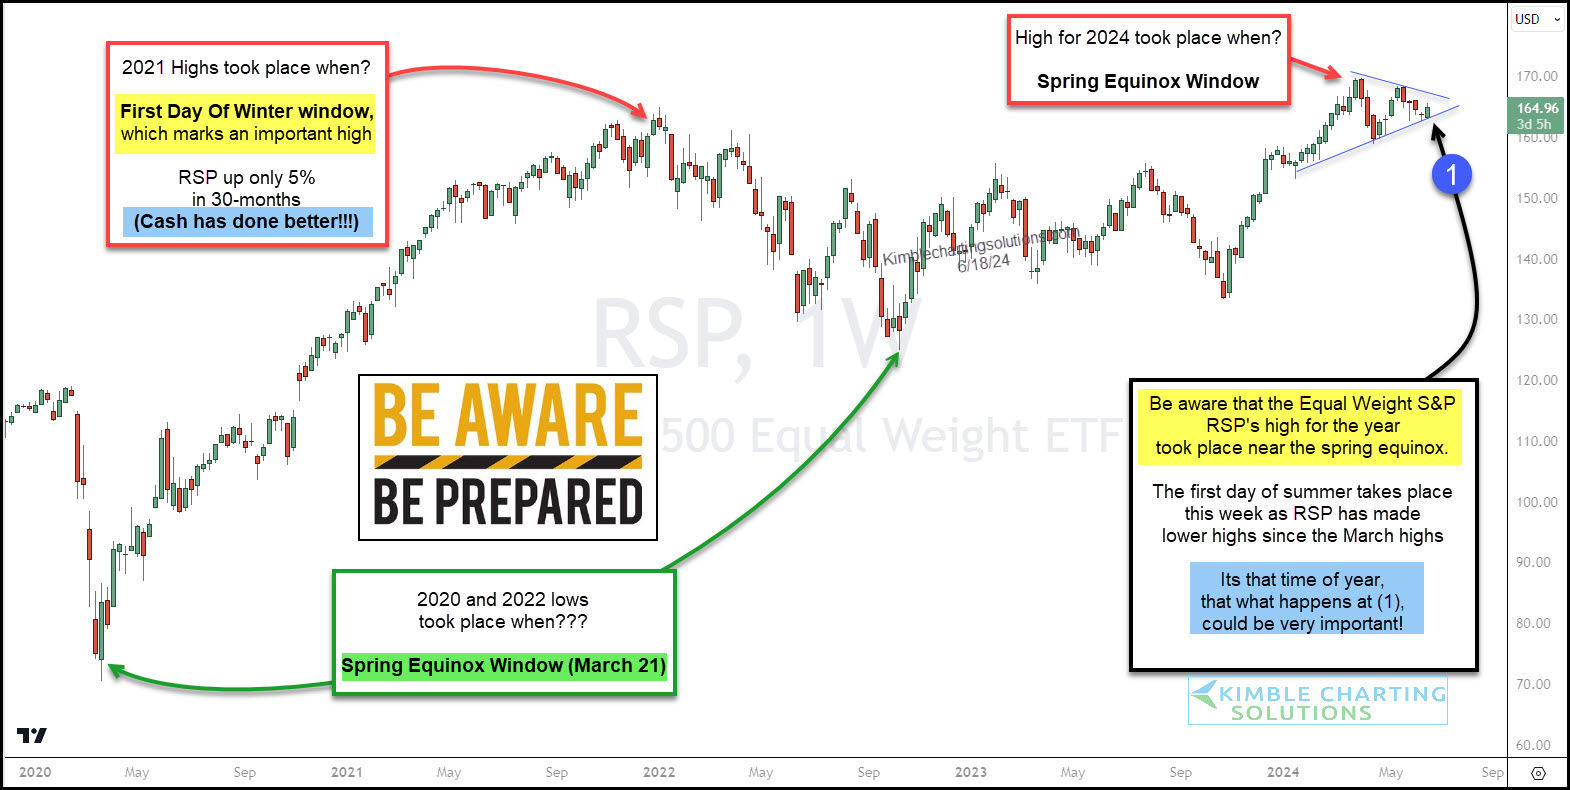
So today, with the S&P 500 Index trading near highs, I think it’s a good idea to check in on the S&P 500 Equal Weight Index.
We’ll do this via the “weekly” chart of the S&P 500 Equal Weight ETF (RSP).
Here we can see that RSP has peaked and bottomed at the start of Spring or Winter on a few occasions. Fast forwarding to Spring 2024, we can see another potential inflection point in the form of a narrowing “triangle” top at (1).
But there’s another important layer of analysis to this. In my 44 years in the business, I still find it ironic to say RSP is in a bull market when it’s barely up 5% over the past 30 months.
This isn’t performing anywhere close to the S&P 500 Index. Even cash has outperformed it by a good bit!
So what’s it going to be? A breakdown and more underperformance (bearish)? Or a breakout and some catchup to the unweighted index (bullish)?
In my humble opinion, what happens at (1) could be the key to understanding the next move in the markets.
(Click on image to enlarge)
More By This Author:
Will Tech Stocks Turn Bearish Here?
Are Semiconductor Stocks Targeting Much Higher Prices?
Gold Miners Facing 13-Year Resistance!!!


Comments
Log in or sign up to join the conversation.