
Is Ransomware Boon For Symantec?
Ransomware attacks are a reminder that Cyber warfare is an emerging battlefield, and we must take every measure to safeguard our national security secrets and systems.
No wonder, the Cybersecurity stocks are cynosure of all eyes today. The London listed Ecsc Group shares are up 26% today.
Have a look at Symantec, a consumer cybersecurity powerhouse, listed in the US. Symantec’s award award-winning anti-virus product helps its customers secure their data. The company also owns LifeLock (a leader in identity theft protection services) and BlueCoat, which offers security solutions for networks and cloud services.
So ideally, the stock should strengthen today. Let us see if the technicals support the bullish macro –
Monthly chart (long run view) - Bullish
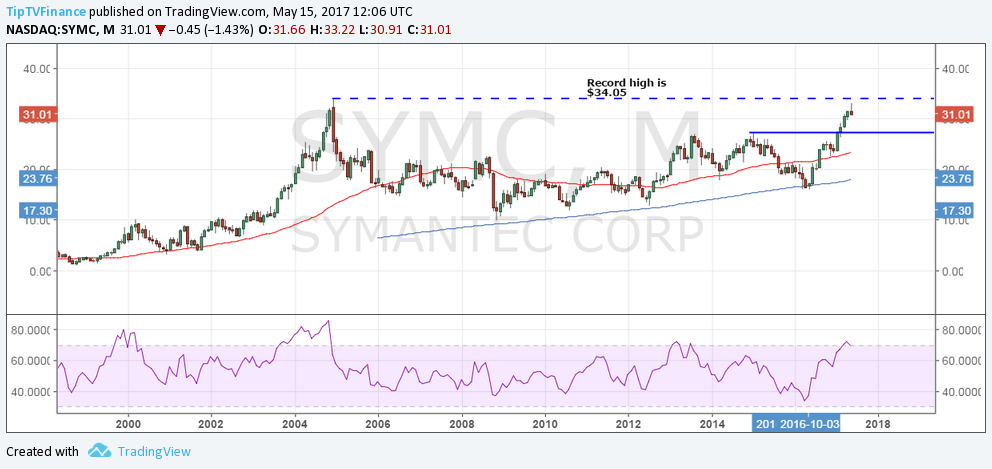
- Record high stands at $34.05
- Strong support at $27.32
- The RSI is overbought, but that by itself does not mean the stock is poised for correction.
- The chart actually looks bullish if we take into account the entire rounding bottom kind of formation from the record high of $34.05 hit in 2004.
- The 50-MA and 200-DMA are perfectly aligned.
- So the monthly chart offers no hope for the bears.
- Pull back to $27.32 (Jan 2015 high) could be a dip buying opportunity.
- Bullish invalidation is seen between 50-MA and 200-MA and only a break below 200-MA would revive the bearish view.
Weekly chart (mid-term view) – Poised for correction
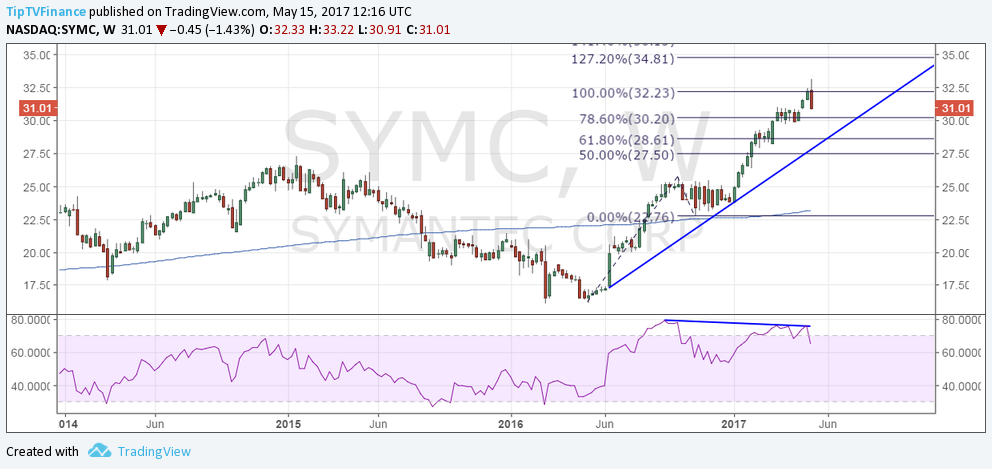
- Bearish price RSI divergence and a potential double top formation on the RSI, coupled with the bearish outside week candle/bearish engulfing and a failure to hold above 100% Fib expansion level of $32.23 suggests the share price is poised for correction.
- The rising trend line support is seen at $28.61, which is also the 61.8% Fib expansion level. A break lower could would expose strong support at $27.32 seen on the monthly chart.
- A gap up opening is likely today, but caution is still advised, given the bearish price action as discussed in the first point.
Daily chart
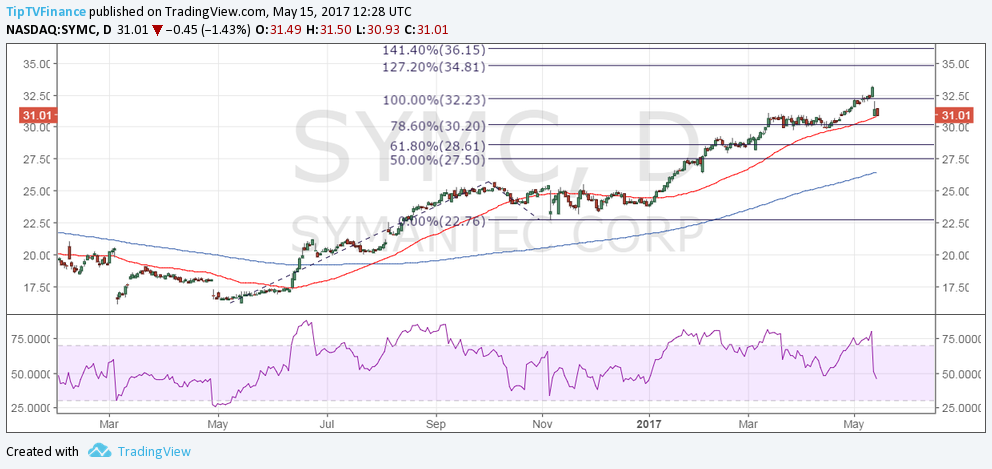
- The RSI is sloping downwards and has already turned bearish (below 50.00).
- A daily close below 50-DMA would add credence to the bearish RSI and open doors for a further correction as discussed in the weekly chart section above.
- Again, the 50-DMA and 200-DMA are perfectly aligned and sloping upwards, suggesting dips are likely to be short lived.
Conclusion:
- Long-run outlook is bullish. A break above the record high of $34.05 would mark a bullish break from the rounding bottom formation and open doors for $60-$70 levels.
- The stock may open higher today in line with the 26% gains seen in the London listed IT management firm Ecsc Group. however, the overbought conditions on the weekly and the daily chart could yield a technical correction; although only a close below monthly 200-MA seen today at $17.95 would revive the bearish view.
Disclosure: None.


