
Is Good News Good For Stocks Or Bad?

The State of the Market
From my seat, the question of the day is if good economic data is good for the stock market, or bad? Cutting to the chase, the answer appears to be, well, it depends on the day.
When Good News Is Good
To review, there are times when good economic data is good for stock prices. For example, when the economy is in the grips of a recession, good economic data signal that conditions are improving, which is likely to lead to better earnings in the future. And since the stock market is... everybody now... a discounting mechanism for future expectations, good economic data means that traders can look ahead to better days - via higher stock prices.
In reality, stocks tend to "sniff out" a turn in the economy before - sometimes long before - the improvement actually shows up in the data. This is why stocks tend to bottom well before the economy officially exits a recession. During this type of environment, good economic data can also serve as confirmation that the rebound in stocks is justified. Which, of course, is a good thing.
When Good News Is Bad
There are also times when good economic news winds up being bad news for the stock market. This tends to occur when the Fed is in the process of juicing the economy. You see, when good economic data shows up while the Fed is in an ultra "easy" mode, traders start to fear that the punchbowl (I.E. All the financial goodness that accompanies easy money policy such as carry trades, etc.) might be pulled prematurely from the stock market party.
Another situation where good economic news can be bad for stocks is when traders are worried about inflation. To be sure, it has been quite some time since anyone has had to worry about inflation running "too hot." For the past decade or so, it has been just the opposite. As in, the problem was too little inflation, not too much. However, those of us that started playing Ms. Market's game in the 1980s remember that too much inflation can also be problematic for stock prices.
And Currently...
The problem currently is that all of the above seems to apply on any given day. One moment, traders are freaking out about bond yields, which purportedly are rising in response to inflation expectations. This creates selling in the high-P/E names due to discounted cash flow analysis. Selling begets more selling in both the stock and bond markets. Rinse and repeat.
The next minute, not so much, as the rise in rates is attributed not to inflation expectations but to the increased supply of bonds that will result from the Dems $1.9 trillion stimulus bill. This narrative was especially prominent as Jay Powell assured folks last week that the Fed sees an increase in inflation to be temporary.
From my seat, it appears that traders are starting to lean toward door number two. Exhibit A in my argument here is that stocks rose on Monday and again on Friday on the back of better-than-expected economic data. On Monday, both the ISM Manufacturing and Construction Spending reports surprised to the upside. If traders were overly worried about inflation being spurred by improving economic conditions, yields would have advanced Monday. But instead, yields actually fell.
And then on Friday, we got a stronger than expected jobs report. This time, yields rose on the news. And so did stocks. A lot. Go figure.
One idea that could be used "explain" the strange behavior in the stock/bond relationship is the fact that the $1.9 trillion stimulus gained traction as the week wore on. And on Saturday, it was passed by the Senate, albeit with no Republican support and by the skinniest of margins.
So... To me, it looks to me like money falling from the sky still trumps the fear of rising inflation. And on both the bond yield and inflation front, I believe the phrase "higher, not high" is the key to the current situation. Although rates and inflation expectations are indeed rising - and may continue to do so for a while - the anticipated boom in the economy may be more important to stocks. Well, except for those companies selling at 150 P/E's of course!
Have a great week! Now let's turn to our expanded weekly model update...
Weekly Model Review
Each week we do a deep dive into our key market indicators and models. The overall goal of this exercise is to (a) remove emotion from the investment process, (b) stay "in tune" with the primary market cycles, and (c) remain cognizant of the risk/reward environment.
The Big-Picture Market Models
We start with six of our favorite long-term market models. These models are designed to help determine the "state" of the overall market.
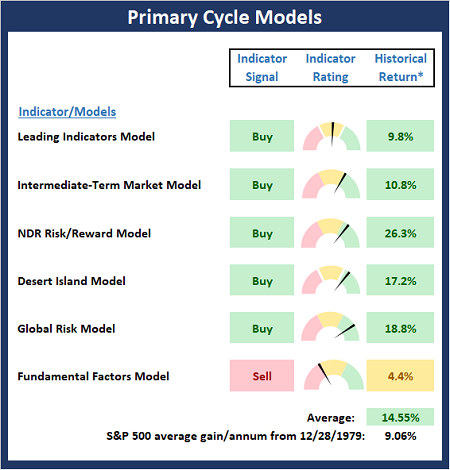
* Source: Ned Davis Research (NDR) as of the date of publication. Historical returns are hypothetical average annual performances calculated by NDR.
The Fundamental Backdrop
Next, we review the market's fundamental factors including interest rates, the economy, earnings, inflation, and valuations.
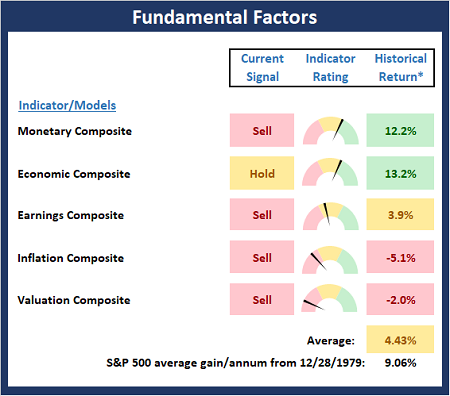
* Source: Ned Davis Research (NDR) as of the date of publication. Historical returns are hypothetical average annual performances calculated by NDR.
The State of the Trend
After reviewing the big-picture models and the fundamental backdrop, I like to look at the state of the current trend. This board of indicators is designed to tell us about the overall technical health of the market's trend.
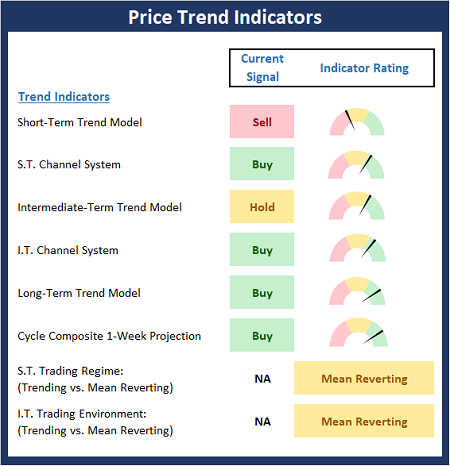
* Source: Ned Davis Research (NDR) as of the date of publication. Historical returns are hypothetical average annual performances calculated by NDR.
The State of Internal Momentum
Next, we analyze the momentum indicators/models to determine if there is any "oomph" behind the current move.
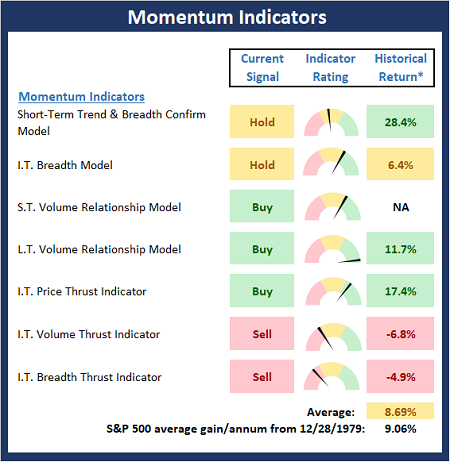
* Source: Ned Davis Research (NDR) as of the date of publication. Historical returns are hypothetical average annual performances calculated by NDR.
Early Warning Signals
Finally, we look at our early warning indicators to gauge the potential for counter-trend moves. This batch of indicators is designed to suggest when the table is set for the trend to "go the other way."
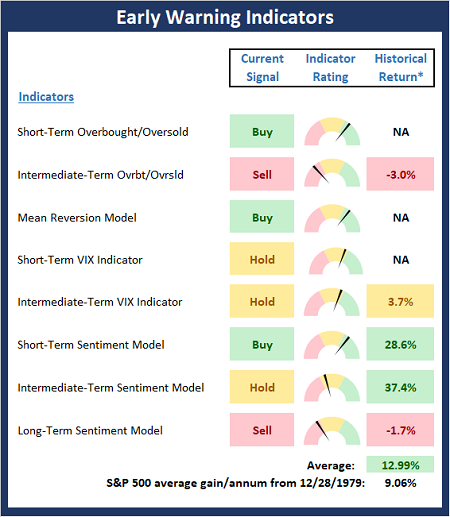
* Source: Ned Davis Research (NDR) as of the date of publication. Historical returns are hypothetical average annual performances calculated by NDR.
The opinions and forecasts expressed herein are those of Mr. David Moenning and may not actually come to pass. Mr. Moenning's opinions and viewpoints regarding the future of the markets should ...
more

