
Investors Intelligence Bulls Reach 99-Week High 60% — Bulls-To-Bears Ratio Still Sub-4
Investors Intelligence bulls hit 60 percent this week – a 99-week high. This was still not good for a bulls-to-bears ratio of four. In the event the current ratio of three-plus extends to four or higher, the S&P 500 can continue to widen its gap with the 200-day, which currently stands at 13.1 percent.
Of the major US equity indices, the S&P 500 large cap index is the latest to have rallied to a new high. The February 19th record high of 3393.52 was surpassed last week, but barely. This week, it cleanly broke out.
Bulls have been on an amazing run. From the March 23rd low through Thursday’s intraday high of 3501.38, the S&P 500 is up nearly 60 percent. This came about in five months – merely five months!
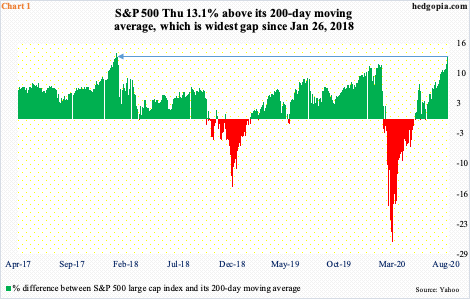
Not surprisingly, several technical indicators are extended, some significantly. The daily RSI is north of 77. Thursday, the S&P 500 (3484.55) was in excess of 403 points above its 200-day moving average, which is the most extended ever. On a percentage basis, however, the index was 13.1 percent above the average, which is high but has been higher historically.
In fact, on July 18, 1933, the S&P 500, which was trading at 12.20 then, opened up a record 57.1 percent gap with its 200-day. This was an aberration. But during times of excessive optimism, the index has routinely traded 15-20 percent above the 200-day. The current 13.1 percent gap is the widest since late January 2018 (Chart 1).
In a crazy market like this, nothing says this metric cannot get even more extended. In this respect, Investors Intelligence bullish percent could be relevant here.
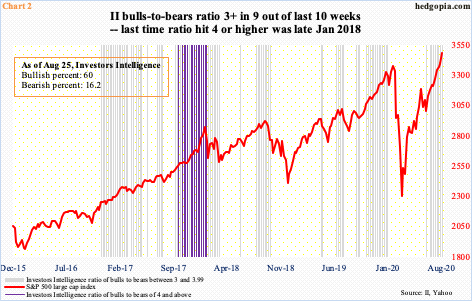
This week, bulls rose eight-tenths of a percentage point week-over-week to 60 percent, while bears dropped three-tenths of a percentage point to 16.2 percent. Bulls have not been this bullish since October 2018. Here is the thing. Back then, bullish sentiment remained in that decile for only two weeks. But before that, in 56 weeks through the end of January 2018, they remained 60 percent or higher in 26 weeks, 17 of them in a row. It was during that time the bulls-to-bears ratio remained at four or higher for 15 weeks (Chart 2).
This year, the S&P 500 bottomed in March, but it was not until the third week of June that the ratio crossed three. Except for one week since then, it has remained north of three – for a total of nine out of 10 weeks. It is yet to crack four. This is what bulls are hoping for. Should this come to pass, the status quo of ‘extended’ continues and gets even more extended.
With that said, bulls are probably not happy with how Thursday traded. A new high was scored, but they were unable to hang on to all the gains, in the end resulting in a doji session. In the event of downward pressure in the sessions/weeks ahead, what happens around 3390s will be telling. In January 2018, the S&P 500 closed 14 percent above its 200-day on the 26th, which was when an 11-session, 11.8-percent decline began.


