
Intermediate-Term Forecast For Saturday, April 4, 2020
Stock Market Commentary
We are two weeks into the rally phase of the intermediate-term cycle that began this week.
The magnitude of the last decline phase signals the likely transition to a bearish intermediate-term trend and favors additional losses during the next decline phase.
S&P 500 Index Weekly Chart Analyses
The following technical and cycle analyses provide intermediate-term forecasts for the S&P 500 index.
Technical Analysis
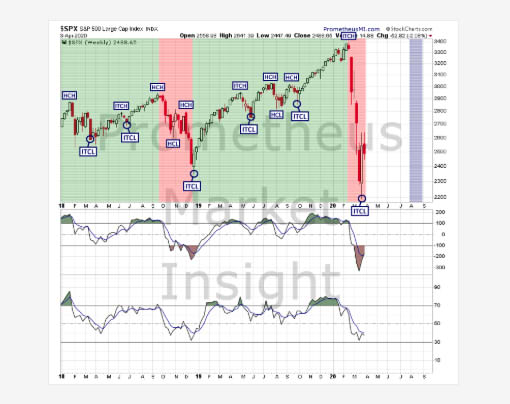
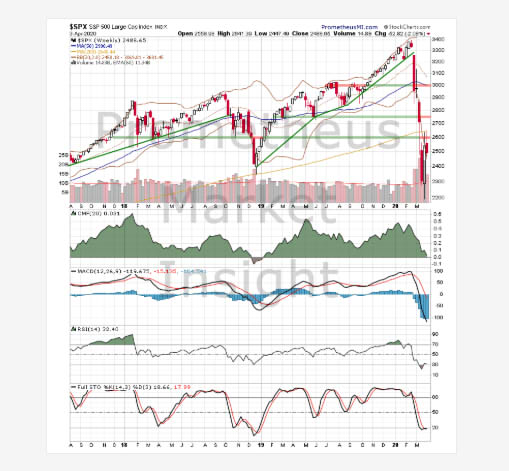
The index closed moderately lower this week, moving down toward previous lows of the violent downtrend from February. Technical indicators are extremely bearish overall, strongly favoring a continuation of the decline.
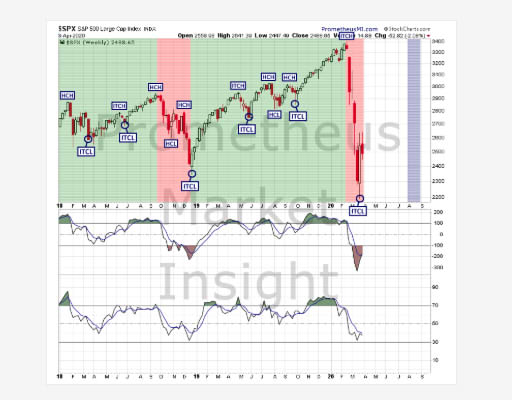
Cycle Analysis
We are two weeks into the rally phase of the cycle following the ITCL that occurred this week. The magnitude of the last decline phase signals the likely transition to a bearish translation and favors additional weakness. The window during which the next ITCL is likely to occur is from July 10 to September 11, with our best estimate being in the August 7 to September 4 range.
- Last ITCL: March 27, 2019.
- Cycle Duration: two weeks.
- Cycle Translation: Bearish.
- Next ITCL Window: July 10 to September 11; best estimate in the August 7 to September 4 range.
- Setup Status: No active setups.
- Trigger Status: No pending triggers.
- Signal Status: No active signals.
- Stop Level: None active.
Intermediate-term Outlook
- Bullish Scenario: A weekly close above congestion resistance at the 2,600 level would predict a move up toward congestion resistance in the 2,750 area.
- Bearish Scenario: A reversal and weekly close below the recent short-term low at 2,290 would reconfirm the downtrend from late February and forecast additional losses.
Both scenarios are equally likely.
We will identify the key developments moving forward as they occur in our daily market forecasts and signal notifications available to paid subscribers. Try ...
more

