
Infrastructure Spending Lifts This Firm To New Heights
It’s no secret U.S infrastructure could be improved. Both the private and public sectors are committed to make significant investments in the coming years to meet the demand for natural gas, alternative energy, and new communication technologies such as 5G. Nevertheless, the market has routed this Industrials stock as it has many other stocks that are not getting a boost from undiscerning passive investing tailwinds.
Investors willing to see past the current economic upheaval can add a high-quality stock to their portfolios at a historically cheap price. MasTec Inc (MTZ: $46/share) is this week’s Long Idea.
MasTec’s History of Profit Growth
MasTec has a strong history of profit growth. Over the past decade, MasTec has grown revenue by 16% compounded annually and core earnings[1] by 18% compounded annually, per Figure 1. Longer-term, MasTec has grown core earnings by 12% compounded annually over the past two decades. The firm increased its core earnings margin from 3% in 2014 to 5% in the trailing-twelve-month period (TTM).
Figure 1: Core Earnings & Revenue Growth Over the Past Decade
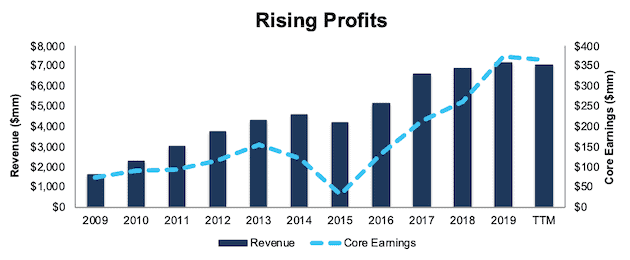
Sources: New Constructs, LLC and company filings.
MasTec’s $517 million in free cash flow (FCF) over the TTM period equates to a 10% FCF yield, which is significantly higher than the Industrials sector average of 2%.
Ample Liquidity to Survive the Downturn
While some industries, such as leisure spending, may see demand evaporate in the short term due to the COVID-19 pandemic, MasTec’s business is more insulated. As a provider of critical infrastructure products (energy transmission, telecommunications towers, etc.), MasTec’s business segments have all been deemed essential and continue to operate.
Even so, MasTec’s available liquidity positions it to weather the economic downturn if needed. At the end of 1Q20, the firm had ~$950 million of cash on hand and available credit.
In a worst-case scenario, where MasTec generates no revenue, the firm could operate for over 17 months with its available liquidity before needing additional capital. This scenario assumes MasTec maintains general and administrative expenses ($85 million in 1Q20) and capex ($300 million midpoint estimate for 2020) at current levels.
However, it’s highly unlikely that MasTec’s revenue would go to zero given the essential nature of its business. The firm generated $1.4 billion in revenue in 1Q20, which included the first few weeks of the many stay-at-home orders issued across the country. Furthermore, management noted in its 1Q20 10-Q that “substantially all the business segments continue to operate.” Management guided for 2020 revenue of $7.3 - $7.7 billion, which at the mid-point, represents a 4% increase over 2019.
Superior Profitability Helps Take Market Share During the Crisis and Grow in the Recovery
COVID-driven disruptions to energy, communications, and power firms may drive weaker operators out of business for good. However, MasTec’s profitability was superior to its competitors before the crisis, and the firm is well-positioned (#3 ranked Specialty Contractor in 2019 by Engineering News-Record) to grow profits when the economy recovers.
Per Figure 2, MasTec’s net operating profit after-tax (NOPAT) margin has improved from 1% in 2015 to 6% TTM. Over the same time, the market-cap-weighted average of 22 other Construction & Engineering firms has hovered ~4%. MasTec’s peer group includes Jacobs Engineering Group (J), Dycom Industries (DY), MYR Group (MYRG), Quanta Services (PWR), and more.
Figure 2: NOPAT Margin Vs. Peers
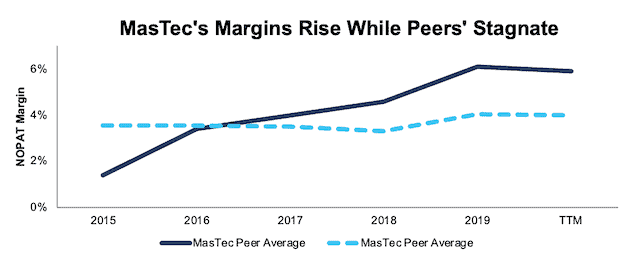
Sources: New Constructs, LLC and company filings.
MasTec’s invested capital turns, a measure of balance sheet efficiency, have improved from 1.4 in 2015 to 1.7 TTM, per Figure 3. The peer group’s market-cap-weighted average invested capital turns have fallen from 2.9 to 1.8 over the same time.
Figure 3: Invested Capital Turns Vs. Peers
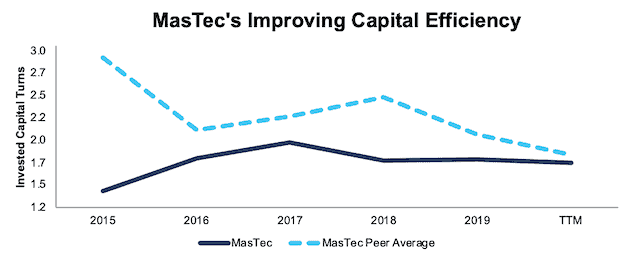
Sources: New Constructs, LLC and company filings.
The combination of rising margins and improving invested capital turns drive MasTec’s leading return on invested capital (ROIC). Per Figure 4, MasTec’s ROIC has improved from 2% in 2015 to 10% TTM while the market-cap-weighted average of peers has fallen from 11% to 6% over the same time.
Figure 4: ROIC vs. Peers
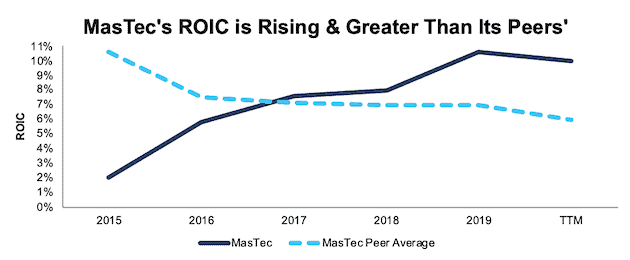
Sources: New Constructs, LLC and company filings.
MasTec’s financial strength and profitability positions the firm to not just survive the downturn, but also to expand its market share during a recovery. During the 1Q20 earnings call, George Pita, MasTec’s CFO stated “suffice it to say that our cash flow, capital structure and liquidity are in excellent shape. And this combination affords us a strong advantage as we navigate through the uncertain economic climate resulting from the COVID-19 pandemic.”
Unless you believe that there will be no need for infrastructure projects in a post-COVID-19 world, it’s hard to argue against MasTec’s ability to survive. And, if it survives, it’s hard to argue that the firm’s superior profitability before the crisis, in an industry where most work is awarded through a bid process predicated on price, will not translate into market share and profit growth after the crisis.
Demand for MasTec’s Products & Services Is Strong Long Term
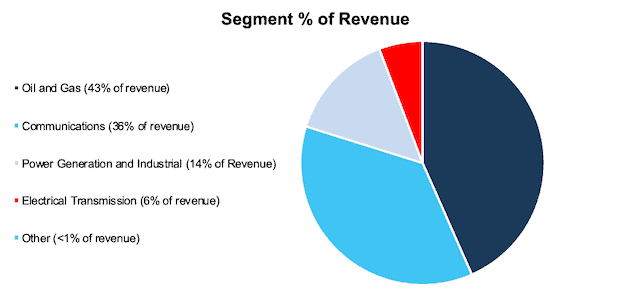
There’s no denying the COVID-19 pandemic could have an adverse impact on MasTec’s business in the short-term, as firms delay capital expenditures and needed investments in infrastructure to maintain liquidity during the crisis. However, MasTec business segments (see Figure 5) are expected to see strong demand over the long-term due to investments in new communication technology (5G towers, faster-wired data networks), pipeline infrastructure, and renewable energy (wind and solar).
Furthermore, we believe a recovery is likely over the long term since the International Monetary Fund (IMF) and nearly every economist in the world believe the global economy will grow strongly in 2021. The IMF estimates the global economy will expand by 5.8%, and the U.S. economy by 4.7%, in 2021. Fitch Ratings projects global GDP growth of 5.1% in 2021, and for “pre-virus levels of GDP” to be reached in mid-2022 in the US and later in Europe. The overall growth in the economy should lead to a rebound in capital expenditures, which present plenty of opportunities for MasTec to increase its market share.
Figure 5: MasTec’s Revenue by Business Segment - 2019
Sources: New Constructs, LLC and company filings.
Oil and Gas is an Opportunity, not Just a Risk
As oil prices plummeted throughout April, shares of many oil exploration and oil-related firms tumbled. However, the market failed to discern between companies most and least, if at all, impacted by the price rout. With 43% of revenue coming from its Oil and Gas segment, it’s easy to lump MasTec in the former, when in reality it belongs in the latter group.
The mix of revenue from oil versus natural gas pipelines in this segment is key. In its 1Q20 earnings call, management noted that over the last three years, MasTec generated ~$10 billion in revenue from its oil and gas segment, but only 6% of that revenue came from oil pipelines. Instead, the firm is heavily involved in natural gas production and transportation.
The United States has been a net exporter of liquified natural gas (LNG) since 2016 and the U.S. Energy Information Administration (EIA) expects U.S. net natural gas exports to almost double by 2021. Longer-term, the EIA’s Annual Energy Outlook 2020 reference case projects U.S. natural gas production to rise from ~35 trillion cubic feet in 2019 to ~45 trillion cubic feet in 2050. Furthermore, the EIA projects LNG exports to rise through 2030.
The increase in production and exports will drive demand for new pipeline infrastructure to move increased volumes to refining centers, distribution hubs, and export facilities. IBISWorld, in its 2019 Oil and Gas Pipeline Construction report, projects capital expenditures by energy producers for pipeline infrastructure in the U.S will grow by ~2% compounded annually over the next five years, to ~$70 billion. As one of the largest pipeline contractors in North America, MasTec is positioned to benefit from the increased demand.
5G Rollout Provides Long-Term Growth Runway
Demand for faster, more reliable wireless and fiber networks provide significant growth opportunities for MasTec as well. Existing relationships with AT&T (T), Verizon (VZ), and other communications service providers (CSPs), along with its expertise in designing, installing and maintaining communications and wireless infrastructure, position MasTec to benefit from this demand.
Specifically, the roll-out of 5G technology is expected not only to be costly but also a long-term investment in the future of communications networks. Gartner forecasts that 5G infrastructure rollout will require a longer period of installation when compared to past changes in wireless infrastructure. In order to maintain performance standards, service providers must improve their 4G infrastructure alongside 5G deployment. Industry research projects an estimated $250 billion will be invested in 5G technologies over the next decade and the U.S. will require ~$150 billion of fiber infrastructure investment over the next five to seven years to support increased data traffic.
Furthermore, Fitch ratings believe the COVID-19 pandemic is unlikely to slow 5G investments in the United States. As one of the largest providers of communications infrastructure services, MasTec, with its existing relationships, is well-positioned to take advantage of 5G roll-out and increased demand for fiber networks.
Backlog Growth Shows Future Demand
While increased demand in infrastructure spending is great news on paper, such growth means little if MasTec cannot successfully win new business. To get a better read on MasTec’s ability to take advantage of this demand, we can look at the firm’s backlog, which represents the amount of revenue expected over the next 18 months from future work on uncompleted construction contracts.
Per Figure 6, MasTec’s estimated backlog has grown from $4.3 billion in 2014 to $8.3 billion at the end of March 2020. The backlog consists of ~$4 billion in communications projects, ~$2.6 billion in oil and gas projects, and another ~$1.3 billion in power generation and industrial projects.
Figure 6: MasTec’s Backlog: 2014 through March 31, 2020
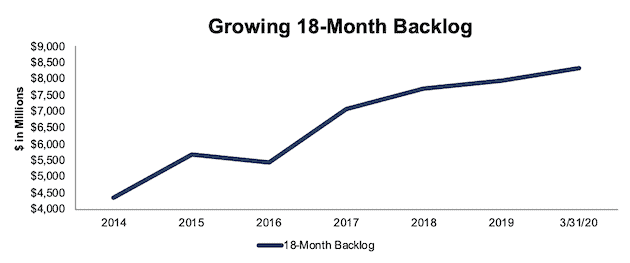
Sources: New Constructs, LLC and company filings.
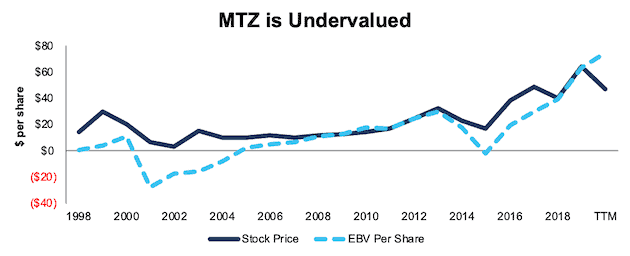
MTZ Trades at Cheapest Level in a Decade
After falling 28% YTD to $46/share, MTZ now trades below its economic book value, or no-growth value, for the first time since 2010. Its current price-to-economic book value (PEBV) ratio of 0.6 means the market expects MasTec’s NOPAT to permanently decline by 40%. This expectation seems overly pessimistic over the long term.
MasTec’s current economic book value is $74/share – a 57% upside to the current price.
Figure 7: Stock Price vs. Economic Book Value (EBV)
Sources: New Constructs, LLC and company filings.
MasTec’s Current Price Implies No Economic Recovery
Despite guiding for revenue growth in 2020, MTZ is priced as if the COVID-driven economic decline is permanent. Below, we use our reverse DCF model to quantify the cash flow expectations baked into MasTec’s current stock price. Then, we analyze the implied value of the stock based on different assumptions about COVID-19’s impact on the economy and MasTec’s future growth in cash flows.
Scenario 1: Using historical revenue declines, historical margins, and average historical GDP growth rates, we can model the worst-case scenario already implied by MasTec’s current stock price. In this scenario, we assume:
- NOPAT margins fall to 1% (lowest of the past decade, compared to 6% TTM) in 2020-2024 and increase to 6% (equal to TTM) in 2025 and each year thereafter
- Revenue falls 18% (double the decline in 2015 – the last time oil prices crashed vs. midpoint guidance of 4% revenue growth) in 2020, and 1% in 2021 (consensus estimate) and does not grow until 2025
- Sales begin growing again in 2025, but only at 3% a year, which is below the average global GDP growth rate since 1961
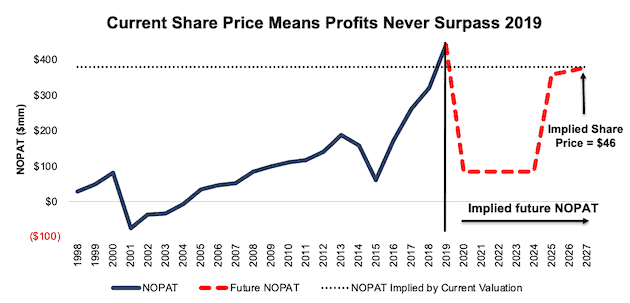
In this scenario, where MasTec’s NOPAT declines 2% compounded annually over the next eight years (including an 81% YoY drop in 2020), the stock is worth $46/share today – equal to the current stock price. See the math behind this reverse DCF scenario.
For reference, MasTec’s NOPAT declined to $59 million, or 63% YoY in 2015, before nearly tripling, to $173 million, just one year later in 2016.
Figure 8 compares the firm’s implied future NOPAT to its historical NOPAT in this scenario. This worst-case scenario implies MasTec’s NOPAT eight years from now will be 14% below its 2019 NOPAT. In other words, this scenario implies that eight years after the COVID-19 pandemic, MasTec’s profits will have only recovered to just above 2018 levels, despite the expected industry growth across each of its business segments. In any scenario better than this one, MTZ holds significant upside potential, as we’ll show.
Figure 8: Current Valuation Implies Severe, Long-Term Decline in Profits: Scenario 1
Sources: New Constructs, LLC and company filings.
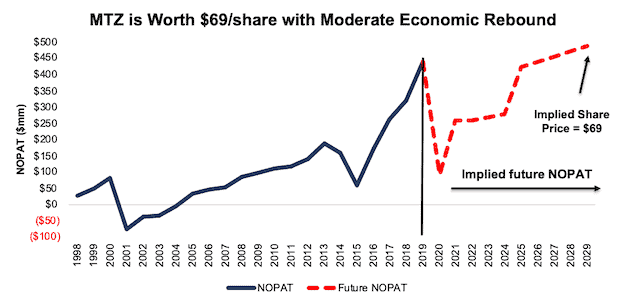
Scenario 2: Long-term View Could Be Very Profitable
If we assume, as does the IMF and nearly every economist in the world, that the global economy rebounds and returns to growth starting in 2021, MTZ is undervalued.
In this scenario, we assume:
- NOPAT margins fall to 1% (lowest of the past decade, compared to 6% TTM) in 2020 and rises to 4% (10-year average) in 2021-2024, and 6% (equal to TTM) in 2025 and each year thereafter
- Revenue falls 9% (equal to the revenue decline in 2015, compared to midpoint guidance of 4% growth) in 2020 and 1% in 2021 (consensus estimate)
- Revenue grows again in 2022, but only at 3.5% a year, which is equal to the average global GDP growth rate since 1961
In this scenario, MasTec’s NOPAT only grows by 1% compounded annually over the next decade (including a 79% YoY drop in 2020) and the stock is worth $69/share today – a 50% upside to the current price. See the math behind this reverse DCF scenario.
For comparison, MasTec has grown NOPAT by 16% compounded annually over the past decade and 12% compounded annually over the past two decades. It’s not often investors get the opportunity to buy an industry leader at such a discounted price.
Figure 9 compares the firm’s implied future NOPAT to its historical NOPAT in scenario 2. This moderate scenario implies that a decade from now, MasTec’s NOPAT will be just 11% above 2019 levels. If the firm’s profits return to these levels in less than 10 years, MTZ has even more upside potential.
Figure 9: Implied Profits Assuming Moderate Recovery: Scenario 2
Sources: New Constructs, LLC and company filings.
Sustainable Competitive Advantages Will Drive Shareholder Value Creation
Here’s a summary of why we think the moat around MasTec’s business will enable it to continue to generate higher NOPAT than the current market valuation implies. The following competitive advantages help MasTec survive the downturn and return to growth as the economy grows again:
- Strong balance sheet to survive the dip
- Manufacturer of highly specialized energy and communications equipment with longstanding customer relationships
- Superior profitability to its peer group
What Noise Traders Miss with MasTec
These days, fewer investors focus on finding quality capital allocators with shareholder-friendly corporate governance. Instead, due to the proliferation of noise traders, the focus is on short-term technical trading trends while high-quality fundamental research is overlooked. Here’s a quick summary of what noise traders are missing:
- Consistent profit growth over the past two decades, throughout economic cycles
- Long-term demand for natural gas transportation and communications/data networks is strong
- Valuation implies the economy never recovers
Repurchases Could Provide Investors with a Nearly 5% Yield
MasTec does not currently pay dividends, but it returns capital to shareholders through share repurchases. MasTec repurchased $321 million worth of shares from 2017-2019. In the three months ended March 31, 2020, the firm repurchased ~$119 million (3% of market cap) worth of shares.
MasTec has not suspended its share repurchase program, noting in its 1Q20 earnings call: “regarding our share repurchase program, we will opportunistically invest in this program if conditions warranted [sic], while also prudently managing our balance sheet.”
As of March 31, 2020, the firm had $159 million remaining for future repurchases under its current authorization. Should the firm exhaust its repurchase authorization, it would represent 4.6% of the current market cap. Not a bad yield for investors willing to look through the current economic uncertainty.
A Consensus Beat or Signs of Recovery Could Send Shares Higher
Despite providing 2020 guidance largely in-line or above consensus estimates, the expectations baked into MasTec’s shares remain pessimistic. According to Zacks, consensus estimates at the end of January pegged MasTec’s 2020 EPS at $5.55/share. Jump forward to June 9, and consensus estimates for MasTec’s 2020 EPS have fallen to $4.74/share. 2021 estimates follow a similar trend. At the end of January 2021 EPS consensus was $6.08/share, which has since fallen to $4.30/share.
Though the COVID shutdowns delayed capital expenditures and lengthened the permitting process across municipalities in which MasTec operates, these lowered expectations provide a great opportunity for a strong business, such as MasTec, to beat consensus, if not this quarter, then maybe the next. Though our current Earnings Distortion Score, which is a short-term indicator of the likelihood to beat or miss expectations, for MasTec is “Miss”, lowered expectations moving forward could make it much easier to beat earnings.
The firm beat EPS estimates in each of the past 18 quarters, and doing so again, in the midst of such market turmoil, could send shares higher. Shares are up 28% since beating 1Q20 estimates and, as shown above, are worth much more in any sort of economic recovery.
Lastly, any signs of a recovery in the global economy would send shares higher.
Executive Compensation Could Be Improved but Raises No Red Flags
No matter the macro environment, investors should look for companies with executive compensation plans that directly align executives’ interests with shareholders’ interests. Quality corporate governance holds executives accountable to shareholders by incentivizing them to allocate capital prudently.
In 2019, 81% to 87% of executive compensation was incentive-based and awarded through short-term cash awards and long-term stock awards. No incentive award can be approved unless the company achieved a target adjusted EBITDA. Beyond EBITDA, the compensation committee considers numerous factors when determining annual incentive awards, such as revenue, cash flow, safety incidents, debt levels, and more.
We would prefer the firm use ROIC improvement when determining executive compensation, as there is a strong correlation between improving ROIC and increasing shareholder value. Having accurate values for NOPAT and invested capital ensures investors have an apples-to-apples metric for measuring corporate performance and holds management accountable for every dollar invested into the company.
Despite not using ROIC when measuring performance, and instead focusing on a flawed metric in adjusted EBITDA, MasTec’s compensation plan has not compensated executives while destroying shareholder value. MasTec has grown economic earnings by 24% compounded annually over the past decade and from -$17 million in 1998 to $181 million over the TTM.
Insider Trading and Short Interest Trends
Over the past three months, insiders have bought a total of 411 thousand shares and sold 7 thousand shares for a net effect of 404 thousand shares purchased. These purchases represent less than 1% of shares outstanding.
There are currently 9.3 million shares sold short, which equates to 17% of shares outstanding and seven days to cover. Short interest is up 9% from the prior month, which indicates any consensus beat or price increase could lead to a short-squeeze and push shares even higher.
Critical Details Found in Financial Filings by Our Robo-Analyst Technology
As investors focus more on fundamental research, research automation technology is needed to analyze all the critical financial details in financial filings as shown in the Harvard Business School and MIT Sloan paper, "Core Earnings: New Data and Evidence”.
Below are specifics on the adjustments we make based on Robo-Analyst findings in MasTec’s 2019 10-K:
Income Statement: we made $168 million of adjustments, with a net effect of removing $47 million in non-operating expenses (<1% of revenue). You can see all the adjustments made to MasTec’s income statement here.
Balance Sheet: we made $880 million of adjustments to calculate invested capital with a net increase of $361 million. One of the largest adjustments was $364 million in asset write-downs. This adjustment represented 10% of reported net assets. You can see all the adjustments made to MasTec’s balance sheet here.
Valuation: we made $1.7 billion of adjustments with a net effect of decreasing shareholder value by $1.7 billion. There were no adjustments that increased shareholder value. Apart from $1.4 billion in total debt, the most notable adjustment to shareholder value was $276 million in deferred tax liabilities. This adjustment represents 8% of MasTec’s market cap. See all adjustments to MasTec’s valuation here.
Attractive Funds That Hold MTZ
The following funds receive our Attractive-or-better rating and allocate significantly to MasTec:
- ICON Natural Resources Fund (ICBCX) – 4.4% allocation and Attractive rating
- Kirr, Marbach Partners Value Fund (KMVAX) – 4.0% allocation and Attractive rating
- Fuller & Thaler Behavioral Small-Cap Equity Fund (FTHFX) – 3.1% allocation and Attractive rating
- Invesco Dynamic Building & Construction ETF (PKB) – 2.5% allocation and Attractive rating
- Queens Road Small Cap Value Fund (QRSVX) – 2.5% allocation and Attractive rating
- Alpha Architect U.S. Quantitative Value ETF (QVAL) – 2.1% allocation and Very Attractive rating
[1] Our core earnings are a superior measure of profits, as demonstrated in In Core Earnings: New Data & Evidence a paper by professors at Harvard Business School (HBS) & MIT Sloan. The paper empirically shows that our data is superior to “Income Before Special Items” from Compustat, owned by S&P Global (SPGI).
Disclosure: David Trainer, Kyle Guske II, and Matt Shuler receive no compensation to write about any specific stock, style, or theme.


