
Inequality Has Never Been Bigger: Financial Assets Hit A Record 620% Of GDP
It was about a year ago when we showed a snapshot of the outrages wealth imbalance in the US with the help of just one metric: as of Aug 2019, Wall Street (US private sector financial assets) was 5.5x the size of Main Street (US GDP), and as BofA's Michael Hartnett pointed out, between 1950 & 2000 the norm was 2.5-3.5x. His conclusion, as recent events have sadly confirmed "Wall Street is now "too big to fail"."
Well fast forward one global pandemic and one unprecedented bailout later, which none other than Hartnett himself framed in the best possible way as follows...
"The monetary and the fiscal stimulus in terms of the announcements thus far, it comes to $20 trillion, $8 trillion of monetary stimulus and $12 trillion of fiscal stimulus. And that number is - it's a little over 20% of global GDP. So it's just astonishing and breathtaking and you have to sort of pinch yourself sometimes to sort of realize that it's actually happening."
... when in his latest Flows and Liquidity report, the BofA Chief Investment Officer provided an update on this most critical metric and it's a doozy.
Dubbing it the "Nihilistic Bull", Hartnett describes the current market as the consequence of a decade-long backdrop of Maximum Liquidity & Minimal Growth still Maximum Bullish, and more importantly, it has led to the value of US financial assets (Wall Street) now hitting an all time high 6.2X size of GDP (Main Street). In other words, not only is Wall Street now "even bigger to fail", but in its attempt to "fix" inequality, the Fed has made it greater than ever, and the now daily violence on America's streets is the most immediate consequence... if only those people protesting knew that they should target their anger not at the Capitol but the Marriner Eccles building.
(Click on image to enlarge)
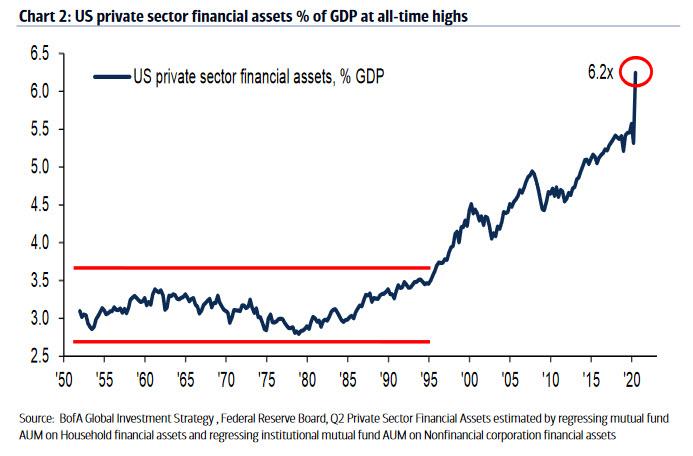
Going back to the chart above, and the market that spawned it, Hartnett writes that "nothing matters but liquidity...GDP loss of $10tn & US claims 53mn numbed by $21tn policy stimulus, $2bn per hour central bank asset purchases." Furthermore, according to the BofA credit strategist, "the structural view on low yields now shared by all...doesn’t mean to say it is wrong...but it’s inciting a bubble" which is why Hartnett is now confident that the scramble into all asset will not end until the S&P is at 4000, gold $3000, and oil $60, all of which are "probably inconsistent with 0% Treasury yields."
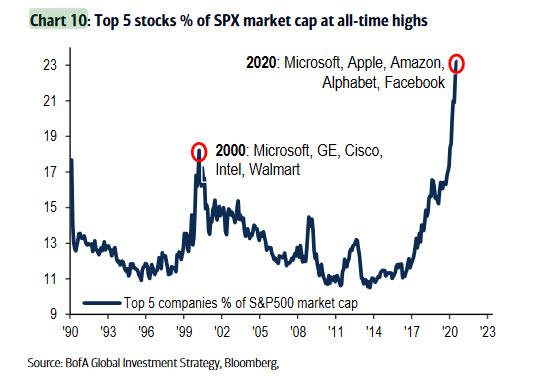
And while not directly caused by it, it's worth recalling that the top 5 stocks are now a record 23% og the S&P500, surpassing dramatically the tech bubble peak:
(Click on image to enlarge)
And in the latest indication of just how long in the tooth the current bubble has become, BofA is now recycling the worst puns of 2018 and 2019, to wit:
I’m so bearish, I’m bullish: Minimal Growth = Maximum Liquidity = Maximum Bullish; narrative of 2010s hardens in 2020 as massive Wall St recovery coincides with Main St recession.
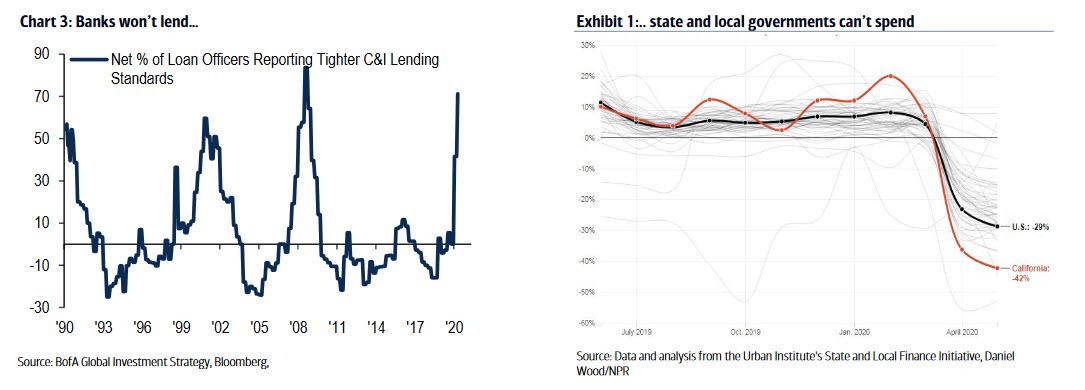
Meanwhile, as the market is stuck in the biggest bubble ever, the economy is disintegrating, as banks refuse to lend (as discussed extensively here), while states can't spend, to wit:
Banks won’t lend: 71% of loan officers reported tighter bank lending standards in Q2, the tightest since Q4 ’08.
(Click on image to enlarge)
State & local governments can’t spend: state tax revenues down 37% YoY in New York, down 42% in California, down 53% in Oregon (Exhibit 1); US state & municipal shortfalls could be >$1tn worse-case in 2020 as no back-to-school, no back-to-office, no back-to-revenue.
All of this is, of course, happening as gold is exploding to daily all-time highs as helicopter money is off the charts and deficits soaring: "U.S. federal budget deficit @ 25% of GDP if Phase IV fiscal stimulus >$1tn, highest since 1943 WWII peak of 27.5%."
(Click on image to enlarge)
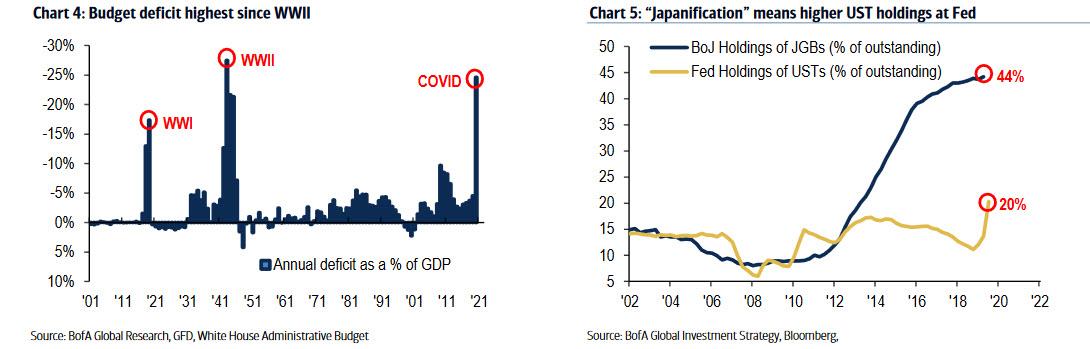
Meanwhile, as even Goldman notes, the Dollar's reserve status is on borrowed time due to a tsunami of printing and debasing: as Hartnett writes, the US debt & deficits to be financed by:
- Fed balance sheet (“Japanification” means higher UST holdings at Fed – Chart 5), and
- Debasement of US dollar; big inflection points in US dollar always harbinger of leadership change (1971 = Stagflation, 1980 = Disinflation, 2001 = Globalization, 2020 = Inflation to solve Inequality).
What does all of this mean for markets? Three things - the "summer dip" Hartnett expected may not be coming after all, but 2020 will be the "big top ", and while 2020 is the megabull unleashed by central banks, 2021 will be the bear:
- Summer dip: late-summer dip (SPX to 3050) thus far wrong but “air pocket” risk grows post +ve July payroll & Phase IV fiscal stimulus; Turkish lira at all-time low = 1st sign capital flow dislocations (as JPY approached 100); lower government yields bullish until credit spreads widen
- Big top: 2020 risk asset peak most likely at time of vaccine, full capitulation by bears, higher interest rates; history of great bear market rallies predicts SPX 3300-3600 top between Aug-Jan; liquidity driving Wall St overshoots until weaker dollar/wider credit spreads signal credit event or fiscal stimulus/higher yields signal recovery.
His conclusion: "2020 = Bull; 2021 = Bear: bigger government, smaller world, US dollar debasement...big picture themes of 2021...buy volatility & inflation assets."
Translation: buy VIX, buy gold.
Disclaimer: Copyright ©2009-2020 ZeroHedge.com/ABC Media, LTD; All Rights Reserved. Zero Hedge is intended for Mature Audiences. Familiarize yourself with our legal and use policies every time ...
more

