
Inditex Presents Its Quarterly Results In A Day Full Of Macroeconomic Data
Yesterday, the market’s attention was focused on the release of important inflation data from the United States, which showed a slight easing as the monthly figure grew by 0.3%, 10% less than expected. The year-on-year CPI also came in 10% below what was expected at 5.3%.

Today's session has also seen the release of CPI data for the UK, France and Italy. The CPI in the UK was reported higher than had been expected by analysts, whilst in France and Italy, CPI has remained respectively in line or slightly better than what was forecast.
From China, we have also seen the release of various macroeconomic data that once again show a slowdown in the economy.
Specifically, we have learned that both the industrial production index and retail sales in China have been worse than expected after being reported at 5.3% and 2.5% against the 5.8% and 7% expected respectively. It is worth noting that this data was not only worse than expected, but also significantly lower than the previous month's figure for the second consecutive month.
This slowdown in the economy is partly explained by the problems derived from the spread of the Delta variant and by uncertainty generated by the growth of inflation and the possible start of tapering.
For the moment, this poor macro data is not being reflected in corporate earnings, as we have seen in recent weeks, and today's session saw this reflected again in the quarterly results of textile giant Inditex.
The group – which includes brands such as Zara, Stradivarius, Pull & Bear, Oysho and Bershka – reported that during the first half of the year it recorded a net profit of 1,272 million euros. This is in stark contrast to the loss of 195 million euros it reported during the same period of time last year, after recording an increase in sales of 49% to those recorded in 2020.
These results confirm the recovery of this company after the good results of the first quarter, especially after it obtained a profit of 850 million euros during the second quarter thanks to strong online sales.
If we look at the daily chart, we can see that, although the long-term trend remains bullish, in recent weeks this company is moving in a range between 28.5 and 30.20 euros per share, thus making a consolidation move after the declines made during the months of June and July after setting annual highs.
These positive results could be the catalyst for a possible upward momentum, if the price is finally able to overcome its current resistance level. Although, the reality is that we cannot rule out the possibility of a further setback since, if the outlook for the future of the economy continues to deteriorate, sales could be negatively affected over the coming months, so we should remain cautious if the price loses its current support levels.
(Click on image to enlarge)
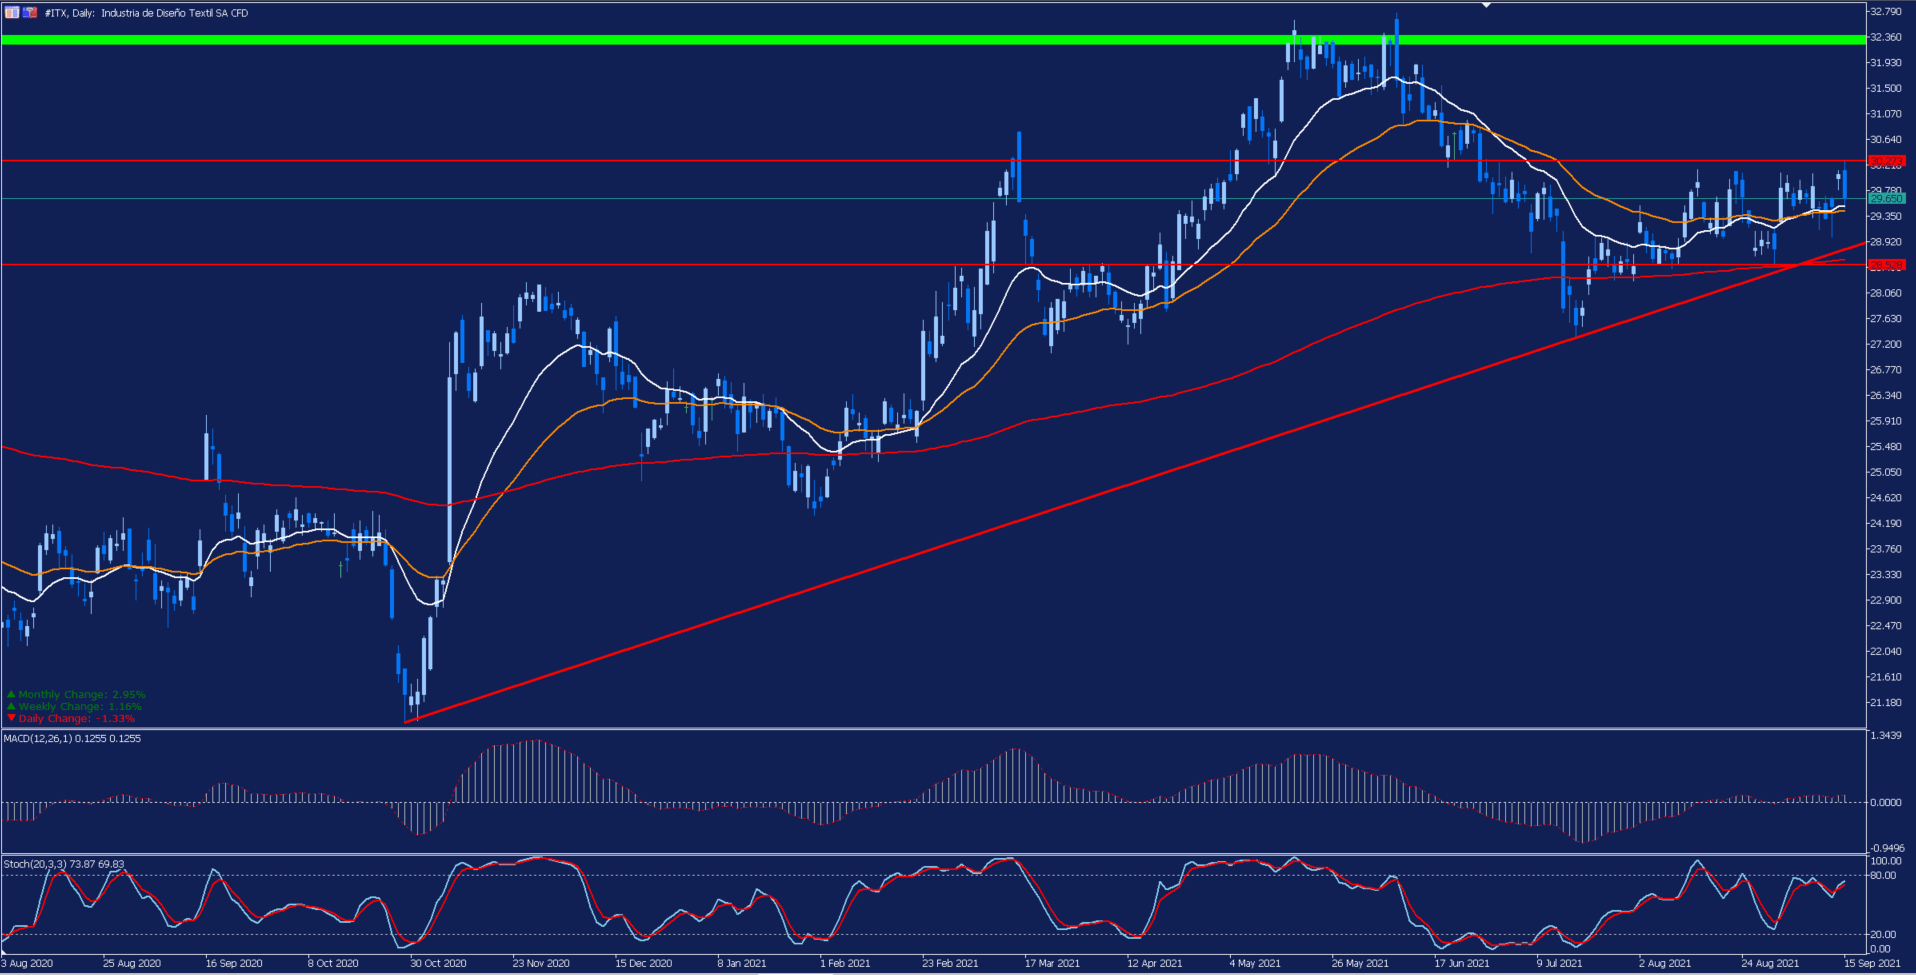
Depicted: Admirals MetaTrader 5 – Inditex Daily Chart. Date Range: 3 August 2020 – 15 September 2021. Date Captured: 15 September 2021. Past performance is not a reliable indicator of future results.
Evolution of the last five years:
- 2020: -17.20%
- 2019: 40.71%
- 2018: -23.05%
- 2017: -10.44%
- 2016: 2.33%
Disclaimer: The given data provides additional information regarding all analysis, estimates, prognosis, forecasts or other similar assessments or information (hereinafter ...
more

