
Indices Defend 200-Day MAs
Last week's selling put pressure on markets not seen since 2016 but the run of good form has meant Tech and Large Cap Indices are only now testing 200-day MAs. There was a brief overshoot on Thursday but the week closed more settled.
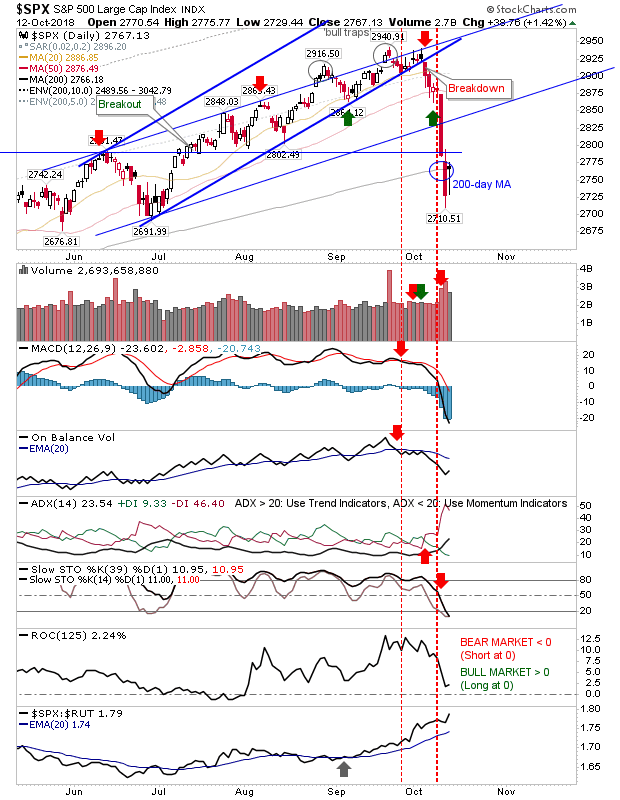
The S&P did well to make it back to its 200-day MA but it complicates the risk:reward which now has a loss of 2,710 as the place for a stop which is well outside most comfort zones. Given that, I would look for some retest of 2,710.
The Dow Jones Industrial Average did a little better in that Thursday's selling didn't undercut its 200-day MA as much as it had in the S&P. Likewise, the index finished with a bullish harami cross which in itself is a bullish opportunity. Stops go on a loss of 24,900. Volume was light so little to say on this.

The Nasdaq was another index to make it back to its 200-day MA. Volume was a little lackluster and technicals are net bearish but the volatility needs to settle down if the sell off is to attract buyers.

The Nasdaq 100 was a little stronger as the doji managed to tag the 200-day MA. Aggressive longs can use the lows of the 200-day MA (200-day MA) to measure risk versus Thursday's lows as for those looking to the Nasdaq.

Even the Semiconductor Index was able to attract buyers at May swing lows. Not surprisingly, this index is heavily oversold and relative performance has been slow to match Tech Indices although overall action looks enough to drive a reversal.

The Russell 2000 was unable to defend its 200-day MA and actually went as far as to tag the 5% loss-line-vs-200-day-MA.However, a long-term buy signal (historically) hasn't kicked in until the index has lost at least 12% to its 200-day MA and really doesn't get interesting until it gets to 17% away from its 200-day MA.

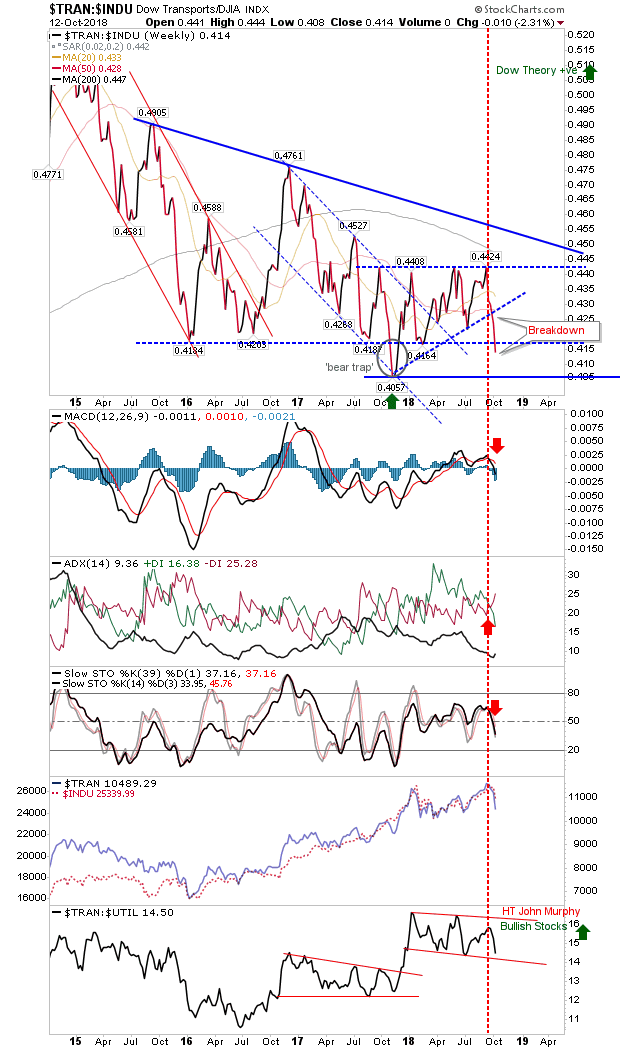
Of breadth indices, there was a push into the 'bear trap' for the relationship between the Dow Transports and the Dow Industrial Averages. This relationship has been in decline in 2015 which has bearish connotations with key moving averages all in the process of rolling over. Friday's losses also delivered 'sell' triggers in the MACD, +DI/-DI and Stochastics. Along with employment figures this is a very bearish looking chart.
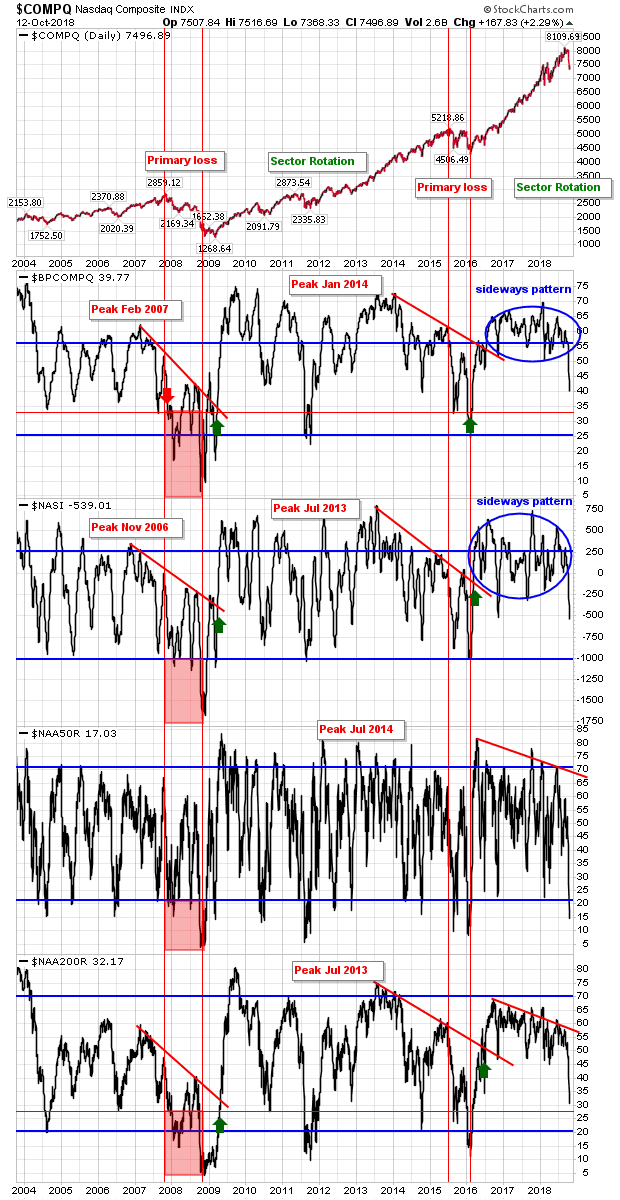
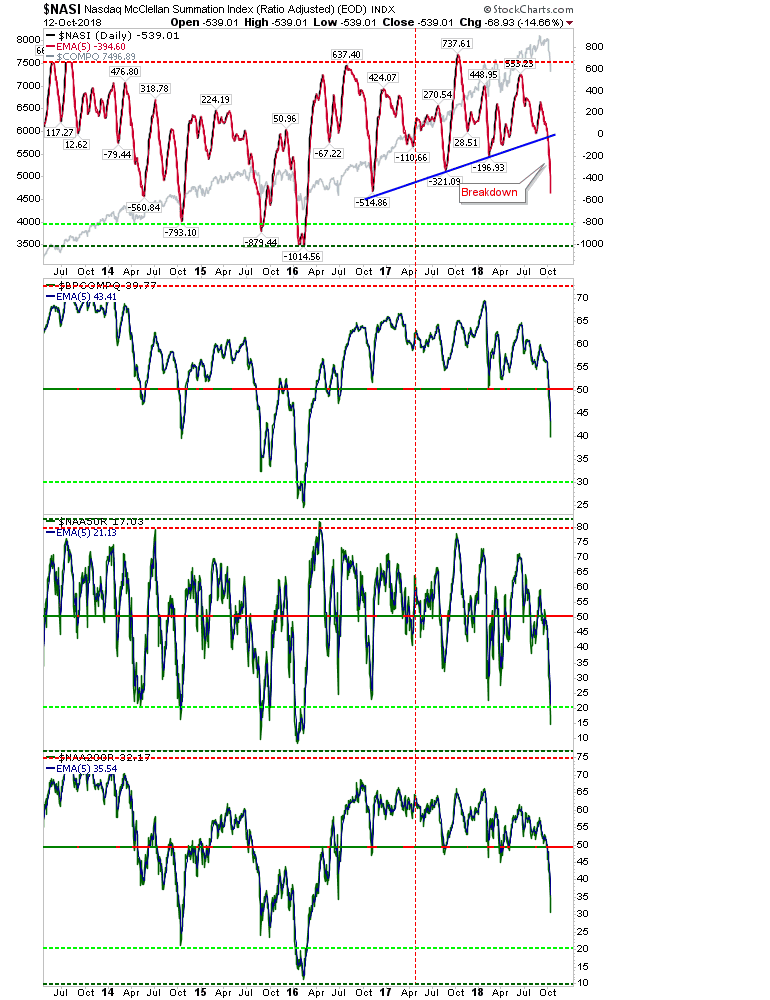
Nasdaq Breadth metrics have cleared the congestion from 2016 but aside from the percentage of Nasdaq stocks above the 50-day MA none are yet oversold at levels which would suggest a bottom is in place.
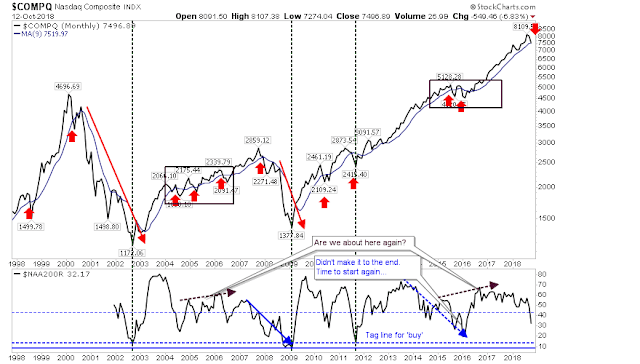
The Monthly chart for the Nasdaq is showing a new 'bear trigger'. The last such trigger was in 2016 but it remains to be seen if this will deliver a 2000 or 2008 style sell-off or simply push things sideways as they did in 2016.
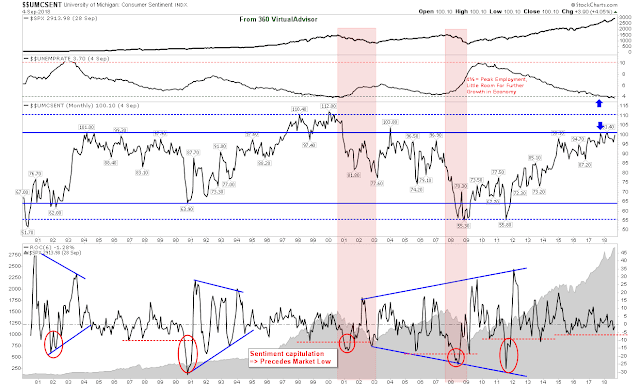
This remains the key chart. Unemployment has reached peak 'top' levels since 2017 but consumer sentiment has not yet weakened to a point of concern. It's hard to see the Trump tax breaks helping Main Street so I would be looking to spike lows in Consumer Sentiment like last seen in 2008 and 2011, with market consequences to follow.
For tomorrow, it will be about indices closing above 200-day MA and narrowing the intraday range - without such action it will be hard for bulls to measure risk:reward - action which remains favored while 200-day MAs are still in play.


