
In Search Of The Best Growth Stocks
Investing in the best growth stocks can generate superior returns over the long term. On the other hand, growth stocks are also particularly volatile and risky. The key, like usually happens, is separating the fundamentally sound companies from the ones with mediocre fundamentals.
The following paragraphs will be presenting a quantitative screener that is focused on companies with consistently above-average growth rates in sales and earnings, while also producing solid profitability.
Only because a company meets the numerical requirements above, this does not guarantee that it will necessarily outperform the market going forward. However, consistent growth leadership and strong profitability metrics can clearly help a lot in terms of identifying promising growth stocks with attractive potential for returns.
Consistent Growth Leadership And Profitability
The screener excludes companies with a market capitalization value below $250 million in order to guarantee a minimum size for the companies in the portfolio. This requirement has a negative impact on potential returns because many times the most explosive growth opportunities come from small companies. After all, it is relatively easier for a small business to sustain rapid growth rates over long periods of time. However, it makes sense to impose a floor on company size for risk management purposes.
After that, the screener requires companies to consistently outperform the industry in terms of revenue growth. In particular, a company must have revenue growth rates above 50% of companies in the industry over three different time frames: The most recent quarter, a trailing twelve-month period, and the past five years.
Revenue growth over those three-time frames also has to be above zero. This is to avoid companies that are outperforming the industry but still generating negative growth because the industry as a whole is declining.
In addition to this, companies in the screener need to have average growth rates in earnings over the most recent quarter, on a trailing twelve-month period, and in the past five years. The main idea is selecting companies with superior performance in both revenue and earnings over different time frames.
These growth retirements are quite demanding. From a universe of nearly 6,000 stocks, only 392 have delivered above-average growth rates in revenue and earnings over different time frames. From that universe of 392 names that meet the specified growth criteria, the screener selects the 50 stocks with the highest ROIC - return on invested capital - ratio.
Leaving the mathematical details aside, the main rationale behind the screener is actually quite simple. The screener is looking for companies with consistent growth leadership and, among those companies, it prioritizes the ones with the strongest profitability levels as measured by ROIC.
Backtested Performance And Recommended Portfolio
The following backtest builds an equally-weighted portfolio with the 50 stocks recommended by the quantitative system, and it evaluates performance since 1999. The backtest makes the decisions based on the information available at each point in time, and it's free from survivorship bias.
Since the screen is based on long-term factors, it does not need to be rebalanced very frequently, so the portfolio is rebalanced once per year. Trading expenses are assumed to be 0.2% per transaction, and the benchmark is the iShares Russell 1000 Growth ETF (IWF).
Since January of 1999 following the portfolio recommendations from the screener produced an average annual return of 12.39% versus 6.14% for the iShares Russell 1000 Growth ETF in the same period. Alpha was 6.45% for the screener during the backtesting period.
(Click on image to enlarge)
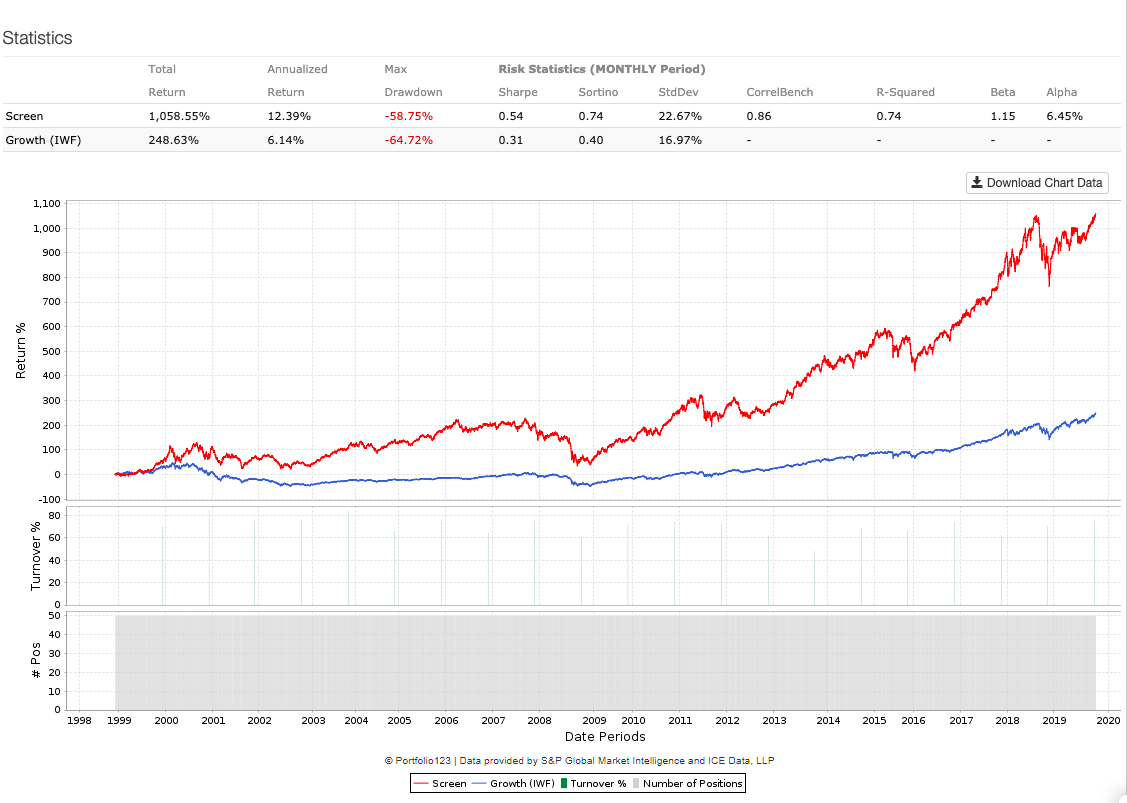
Data from S&P Global via Portfolio123
In plain English, a $100,000 investment in the iShares Russell 1000 Growth ETF in January of 1999 would have a current market value of nearly $348,600, and investors following the portfolio recommendations from the quantitative screener would have made as much as $1.16 million based on the backtesting data.
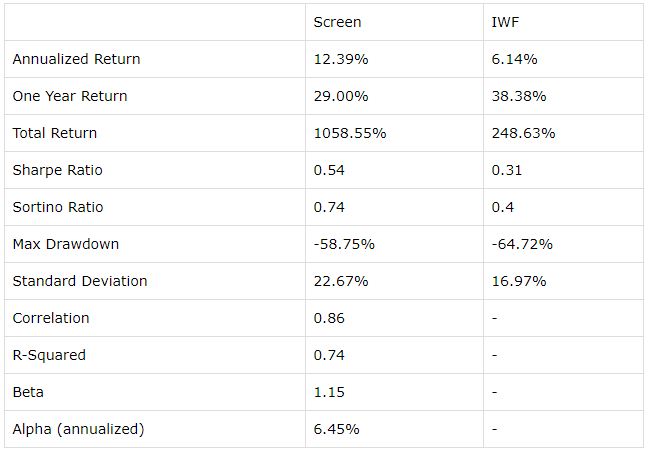
The screener has a lower risk than the benchmark in terms of maximum drawdown, meaning maximum capital loss from the peak. But the volatility levels are higher for the quantitative screener as measured by the standard deviation. Risk-adjusted return metrics such as Sharpe and Sortino ratios are clearly stronger for the screener in comparison to the benchmark.
The table below summarizes some key performance metrics for the screen and the benchmark over different periods.
(Click on image to enlarge)
Practical Considerations And Portfolio
There are some important considerations to keep in mind when assessing the stocks in the screener portfolio. To begin with, companies are selected based on their growth metrics in comparison to the industry. In industries in which most players are producing mediocre numbers, outperforming the industry is really not much of an achievement.
Like all quantitative screeners, the criteria for selection is based on past or current data. History and numbers say a lot about a business, but each individual stock needs to be analyzed based on the company's potential to sustain performance going forward. Sometimes growth slows down as a company gains size and the industry matures over time, and past performance is no guarantee of future returns.
Backtested performance should always be taken with a grain of salt, especially for screeners that are based on a single factor such as growth. Growth stocks in general have massively outperformed the market over the past decade. It would not be much of a surprise to see growth underperforming versus other factors such as value in the middle term if there is any reversion to the mean in relative factor performance.
Speaking about value, this screener does not include any valuation criteria for the companies in the portfolio. Especially when investing in growth stocks, paying an excessively high valuation can be remarkably problematic, because these kinds of companies generally trade at above-average valuations.
This limitation could easily be fixed by incorporating some valuation requirements into the screener. Using the PEG - price to earnings growth - ratio could be particularly appropriate in this case. However, this is beyond the point. The main idea in this article is showing how top-quality growth stocks can be remarkably attractive investment ideas, irrespective of valuation levels.
The point is that the screener provides only a list of potential candidates for further research. Investors should take a deep look at each of the companies in the list before committing any hard-earned money to them, analyzing aspects such as the company's ability to sustain growth in the future and valuation levels.
That being said, the table below shows the 50 positions currently selected by the screener. Data in the table also shows market capitalization in millions and percentage sales growth in the past five years and on a trailing twelve months basis to provide a quick reference on growth rates.
| Ticker | Name | MktCap | Sales 5yr | Sales TTM |
| AMRN | Amarin Corporation PLC | $7,504.49 | 54.13 | 76.82 |
| ANET | Arista Networks Inc. | $15,743.26 | 42.89 | 21.27 |
| ATHM | Autohome Inc. | $9,407.88 | 39.24 | 15.72 |
| BSTC | BioSpecifics Technologies Corp. | $428.68 | 17.96 | 21.69 |
| CNS | Cohen & Steers Inc. | $3,030.77 | 5.06 | 2.13 |
| OTCPK: CNSWF | Constellation Software Inc. | $21,322.12 | 20.83 | 15.5 |
| CYBR | CyberArk Software Ltd. | $4,410.63 | 38.99 | 31.4 |
| DPZ | Domino's Pizza Inc. | $11,942.51 | 13.75 | 9.51 |
| DMLP | Dorchester Minerals L.P. | $658.23 | 2.15 | 15.69 |
| EVR | Evercore Inc. | $3,019.22 | 21.72 | 21.03 |
| EXPO | Exponent Inc. | $3,649.55 | 5.08 | 6.27 |
| FB | Facebook Inc. | $588,780.21 | 47.97 | 28.2 |
| OTCQX: FMCB | Farmers & Merchants Bancorp | $609.14 | 10.13 | 18.79 |
| HLG | Hailiang Education Group Inc. | $1,657.53 | 23.96 | 23.57 |
| HLF | Herbalife Nutrition Ltd. | $6,645.97 | 0.27 | 0.94 |
| HUM | Humana Inc. | $48,837.38 | 6.62 | 12.21 |
| IDXX | IDEXX Laboratories Inc. | $22,464.01 | 9.96 | 8.34 |
| INCY | Incyte Corp. | $19,405.20 | 39.6 | 17.25 |
| INS | Intelligent Systems Corp. | $381.72 | 4.26 | 81.14 |
| INTU | Intuit Inc. | $69,540.83 | 9.84 | 13.08 |
| IRWD | Ironwood Pharmaceuticals Inc. | $2,142.00 | 72.22 | 39.54 |
| OTCPK: KXSCF | Kinaxis Inc. | $2,071.30 | 19.9 | 18.17 |
| KL | Kirkland Lake Gold Ltd. | $8,556.83 | 41.12 | 47.17 |
| LXRX | Lexicon Pharmaceuticals Inc. | $468.66 | 95.35 | 317.27 |
| MKTX | MarketAxess Holdings Inc. | $14,217.75 | 13.09 | 17.64 |
| MA | Mastercard Inc. | $301,555.71 | 12.46 | 12.6 |
| MED | Medifast Inc. | $1,219.26 | 9.1 | 59.03 |
| MSFT | Microsoft Corp. | $1,201,667.97 | 7.8 | 12.97 |
| MNST | Monster Beverage Corp. | $34,554.58 | 11.13 | 11.24 |
| EDU | New Oriental Education & Technology Group Inc. | $19,532.36 | 22.15 | 25.03 |
| NVR | NVR Inc. | $14,203.06 | 11.22 | 6.03 |
| OTCQX: OTCM | OTC Markets Group Inc. | $400.95 | 11.06 | 7.93 |
| PAYX | Paychex Inc. | $30,653.95 | 8.41 | 15.13 |
| PAYC | Paycom Software Inc. | $15,194.93 | 39.4 | 31.05 |
| PTLA | Portola Pharmaceuticals Inc. | $2,040.27 | 30.68 | 196.49 |
| PFBC | Preferred Bank of Los Angeles | $855.73 | 23.32 | 24.65 |
| RIGL | Rigel Pharmaceuticals Inc. | $353.65 | 44.15 | 1128.88 |
| OTCQX: RHHBY | Roche Holding AG | $273,439.66 | 2.06 | 8.66 |
| SPGI | S&P Global Inc. | $66,393.70 | 5.88 | 3.04 |
| OTC: SMLR | Semler Scientific Inc. | $312.69 | 56.71 | 49.86 |
| SBUX | Starbucks Corp. | $104,789.71 | 10.02 | 7.24 |
| TTWO | Take-Two Interactive Software Inc. | $13,992.03 | 2.57 | 75.85 |
| AMTD | TD AMERITRADE Holding Corp. | $27,281.60 | 14.01 | 10.34 |
| TER | Teradyne Inc. | $11,684.78 | 8.03 | 4.81 |
| TPL | Texas Pacific Land Trust | $5,940.48 | 46.75 | 90.45 |
| TREX | Trex Co., Inc. | $5,125.23 | 14.95 | 7.15 |
| UI | Ubiquiti Inc. | $12,234.37 | 15.21 | 14.06 |
| VEEV | Veeva Systems Inc. | $21,047.83 | 32.62 | 25.62 |
| V | Visa Inc. | $406,268.00 | 12.59 | 11.49 |
| XPEL | XPEL Inc. | $401.49 | 43.76 | 13.41 |
Disclosure: I am/we are long ANET, FB.
Disclaimer: I wrote this article myself, and it expresses my own opinions. I am not receiving compensation for it. I have no business relationship with ...
more

