
In Search Of Growth Leaders With Strong Momentum
Investing in companies with superior growth can lead to outstanding returns over the long term. However, picking the best growth stocks is easier said than done, and a good idea without the right implementation can do more harm than good. This is especially true among growth stocks because these kinds of companies are particularly volatile and risky, so picking the wrong names can produce severe losses.
This article is presenting a quantitative screener that looks for companies with consistently above-average growth rates over different periods and vigorous momentum in terms of both fundamentals and price performance.
The main idea is focusing on companies that have proven their ability to outperform the competition over different time frames since this generally indicates that the business has superior fundamental qualities and competitive strengths.
In order to accelerate returns and also at the expense of increasing volatility, the strategy will also focus on companies exhibiting strong momentum. In simple terms, we are looking to buy leading growth stocks, and we are looking to buy them when they are producing solid price gains and outperforming earnings expectations.
Looking For Consistent Growth Leaders
Growth investing can be a particularly profitable and exciting investment strategy. However, growth stocks also trade at relatively expensive valuations, which is always a major risk factor. A high growth stock obviously deserves to trade at a higher valuation level than a low growth stock. But the sustainability in growth rates is the key variable to consider.
If growth rates decelerate more abruptly than is expected, high-growth stocks trading at demanding valuations are vulnerable to big drawdowns. Conversely, companies that can sustain superior growth rates for long periods of time are the ones that can deliver explosive returns for shareholders over the years.
The quantitative system starts with a screener that requires companies to have positive sales growth over the past 12 months, and the company also needs to deliver revenue growth rates above 50% of stocks in the industry over 3 different time frames: The most recent quarter, a trailing twelve-month period, and the past three years.
If the company is consistently outgrowing the competition in multiple time frames, this is indicating that it has superior fundamental qualities and competitive strengths, such as better technologies, a more innovative management team, or superior brand power.
This requirement for consistent growth does a lot of the heavy lifting in the stock selection process. We begin with a universe of almost 6,600 stocks, and when filtering for liquidity and consistent growth leadership, we are left with nearly 1,250 names available for inclusion.
Adding Some Momentum To Spice Performance
The Stocks on Fire system is a quantitative algorithm that ranks stocks in a particular universe based on a combination of two main factors: fundamental momentum and price momentum.
Fundamental momentum evaluates how earnings and sales expectations are evolving for the company. Mathematically, this factor measures the percentage increase in sales and earnings expectations for the company in both the current year and next year.
When expectations are increasing, this is indicating that the company is doing better than previously expected, which can be a powerful driver for the stock price.
The price-performance component in the ranking system measures price changes over the past 4 quarters. This factor is looking for stocks that are consistently outperforming the market over recent time periods. In other words, we are looking for strong momentum at the fundamental level to be also reflected on strong momentum at the price-performance level
Adding momentum to the strategy makes it more explosive in terms of performance expectations, for better or for worse. There is plenty of academic research evidencing that high momentum stocks tend to outperform over the long term, but these kinds of stocks are also more volatile than average, and they can be prone to sharp price reversals.
Backtested Performance
The backtest is based on the following criteria.
- Stocks with a market capitalization value below $250 million are excluded from the investable universe. This is to guarantee a minimum size and liquidity level.
- The revenue growth rate on a trailing 12 months basis has to be above zero.
- Companies need to have a revenue growth rate above 50% of companies in the industry over the past three years, the trailing twelve months period, and the past quarter.
- Among the companies that meet the criteria above, the strategy selects the 30 names with the highest ranking based on the Stocks on Fire algorithm.
- The portfolio is rebalanced every four weeks, and trading expenses are assumed to be 0.2% per transaction.
- The benchmark is the SPDR S&P 500 (SPY) ETF
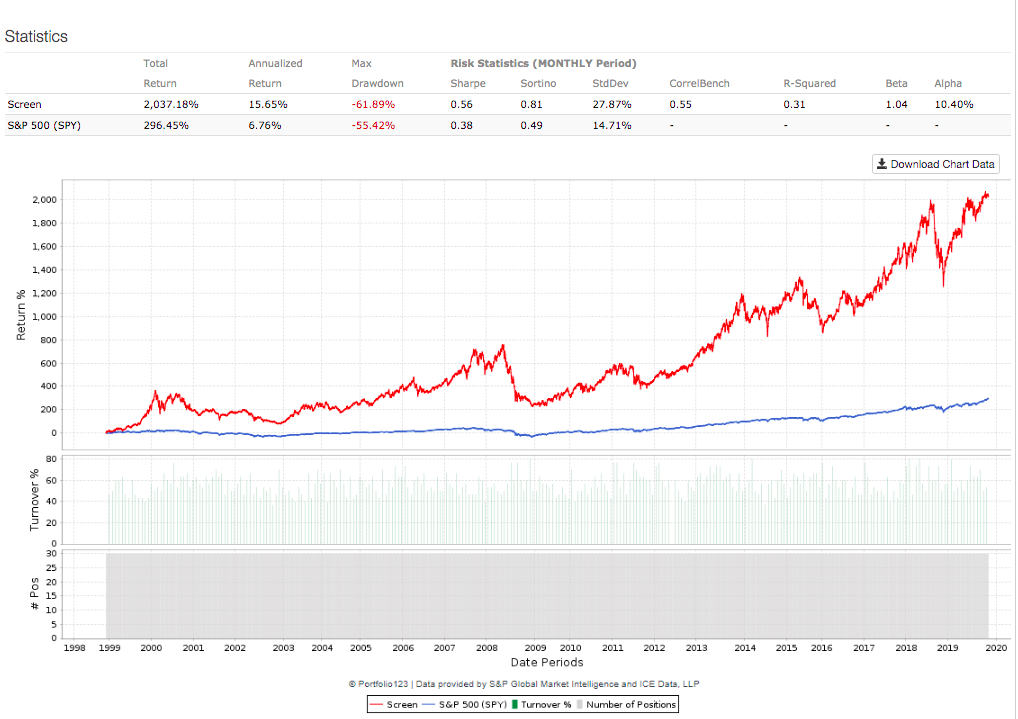
Since January of 1999, the strategy gained 2037% versus 296% for SPDR S&P 500. The annual return is 15.65% for the strategy versus 6.76% for the benchmark, and Alpha for the quantitative strategy is 10.4% per year.
(Click on image to enlarge)
Data from S&P Global via Portfolio123
In simple terms, a $100,000 position in the portfolio recommended by the quantitative strategy would currently be worth $2.1 million, while the same amount of capital allocated to SPDR S&P 500 would have a current value of $396,000.
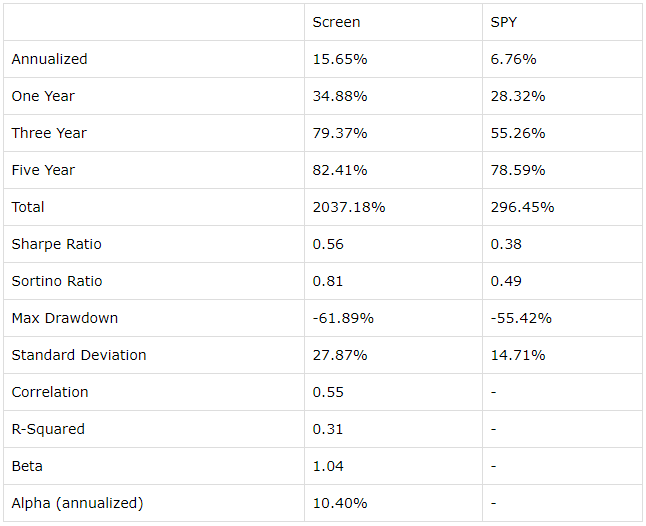
But the ride would have been quite bumpy. The strategy outperforms the benchmark in terms of risk-adjusted returns as measured by the Sharpe and Sortino ratios, but the strategy is also more risky and volatile. This is quite easy to see when looking at metrics such as standard deviation and maximum drawdown.
(Click on image to enlarge)
Data from S&P Global via Portfolio123
Practical Considerations And Results
A strategy such as this one is not for everyone. You need to be able to tolerate substantial volatility, and looking at historical backtested data does not replicate the real experience when prices are moving in the wrong direction.
It is one thing to look at historical returns and volatility and believe that you would have been able to tolerate the drawdowns. However, when facing volatility in real-time and with real money on the line, fear and anxiety can be much more problematic.
When you look at the historical data you know that values eventually recovered, but when facing the drawdowns in real-time, you never know if the strategy will recover or how long it will take to do so.
An interesting possibility would be reducing downside risk with trend-following strategies to hedge the portfolio when the market is in a downtrend. This would reduce big drawdowns over the long term, but it would make performance harder to predict in the short term.
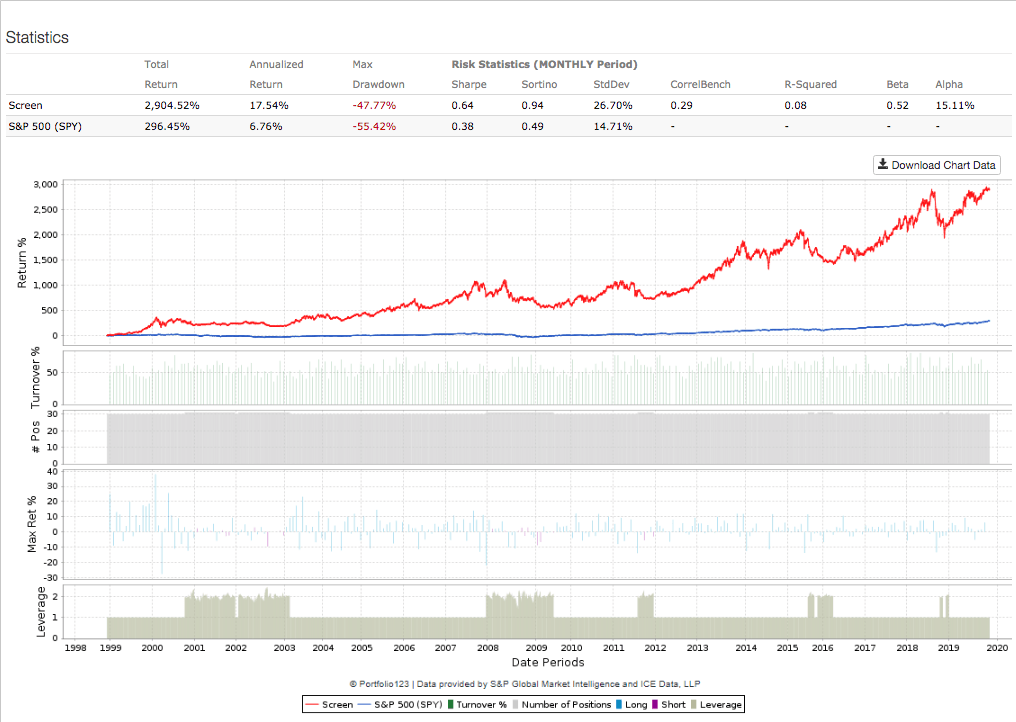
The backtest below shows the performance data for a dynamically hedged version of the strategy, this version takes a short position of 100% of the portfolio capital in SPDR S&P 500 when the ETF has a downward sloping 200-day moving average.
(Click on image to enlarge)
Data from S&P Global via Portfolio123
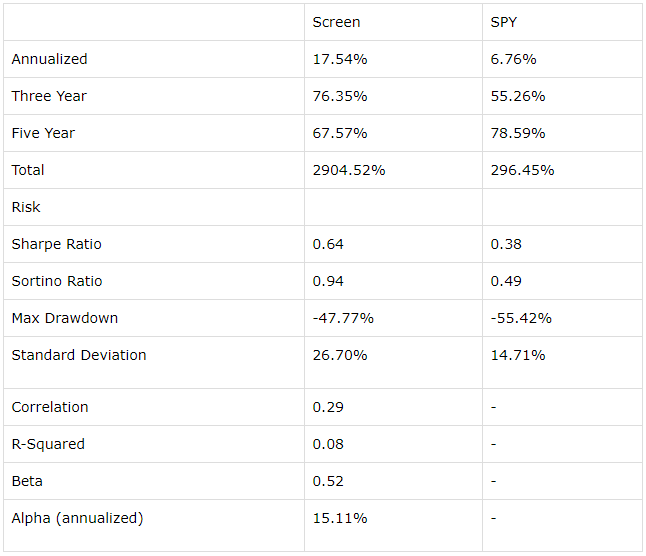
As we can see, this dynamically hedged version has both higher returns and smaller downside risk than the long-only version of the strategy, but it also underperforms the benchmark in the past five years.
(Click on image to enlarge)
Data from S&P Global via Portfolio123
Looking at the screener criteria itself, the fact that a stock is outgrowing other companies in the industry does not guarantee that growth rates will necessarily be attractive in absolute terms.
In industries such as retail, energy, or financials, many players are delivering declining revenue, so a company can outgrow the competition with mediocre top-line performance and even when declining sales.
Momentum also cuts both ways. The companies that are delivering the biggest gains today can also be the ones that deliver the sharpest losses when the markets turn around. This strategy is better suited for investors who deeply understand how to manage and tolerate portfolio risk.
In any case, this quantitative screener is by no means intended as a list of recommendations to buy. The main idea is showing how growth leadership and momentum can drive market-beating returns over the long term and providing a list of ideas with strong quantitative attributes for further research.
The table below shows the 30 stocks currently selected by the quantitative strategy. Data also includes market capitalization in millions and the percentage increase in revenue on a trailing twelve months basis.
| Ticker | Name | MktCap | SalesG% |
| ARES | Ares Management Corp. | $4,348 | 45.1 |
| ARWR | Arrowhead Pharmaceuticals Inc. | $4,413 | 945.69 |
| BOOT | Boot Barn Holdings Inc. | $1,253 | 12.97 |
| CABO | Cable One Inc. | $9,727 | 5.56 |
| CDLX | Cardlytics Inc. | $2,228 | 32.94 |
| CNS | Cohen & Steers Inc. | $3,472 | 7.8 |
| CPRT | Copart Inc. | $23,220 | 15.54 |
| CROX | Crocs Inc. | $2,890 | 10.48 |
| DRNA | Dicerna Pharmaceuticals Inc. | $1,338 | 224.18 |
| LPG | Dorian LPG Ltd | $779 | 58.25 |
| PLOW | Douglas Dynamics Inc | $1,252 | 10.39 |
| EVER | EverQuote Inc | $1,025 | 37.73 |
| FRTA | Forterra Inc | $949 | 0.27 |
| GNRC | Generac Holdings Inc | $6,441 | 11.45 |
| HIBB | Hibbett Sports Inc | $449 | 21.43 |
| IPHI | Inphi Corp | $3,840 | 18.94 |
| IBP | Installed Building Products Inc | $2,374 | 14.05 |
| PODD | Insulet Corp. | $11,863 | 31.03 |
| LULU | Lululemon Athletica Inc. | $31,670 | 22.94 |
| LITE | Lumentum Holdings Inc. | $6,098 | 22.27 |
| LUNA | Luna Innovations Inc. | $256 | 64.56 |
| MX | MagnaChip Semiconductor Corp. | $532 | 3.42 |
| NVRO | Nevro Corp. | $3,919 | 1.73 |
| PRFT | Perficient Inc. | $1,558 | 10.38 |
| PFNX | Pfenex Inc. | $358 | 8.01 |
| REPH | Recro Pharma Inc. | $367 | 26.4 |
| SPNS | Sapiens International Corp NV | $1,323 | 8.43 |
| SEDG | SolarEdge Technologies Inc. | $5,282 | 47.31 |
| SPAR | Spartan Motors Inc. | $611 | 31.34 |
| TSLA | Tesla Inc. | $102,996 | 39.35 |
Disclosure: I/we have no positions in any stocks mentioned, and no plans to initiate any positions within the next 72 hours.
Disclaimer: I wrote this article myself, and it expresses my ...
more

