
How To Value Thematic Strategies
During the pandemic, we’ve seen an evolution of behavioral changes fuel transcendent trends across our economy that may create new future growth opportunities.
This has spurred investor interest in thematic ETFs that seek to provide exposure to firms at the forefront of innovation. In 2020, more than $40 billion flowed into ETFs focused on Future Communication, Clean Energy, Smart Transportation, and Cloud Computing.1
To formulate a fundamental view on these areas of innovation, it is important to consider which valuation metric may be the most appropriate.
Fundamentally thematic
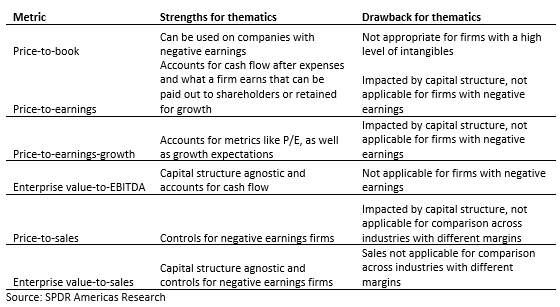
Selecting the most appropriate metric requires understanding the type of firms typically found in the 145 funds we identify as thematic strategies. Our security look-through analysis finds many of these funds are concentrated in the Consumer Discretionary, Health Care, and Information Technology sectors. Importantly, the firms in those sectors typically have significant intangible assets2 on their balance sheets. Price-to-book may not be the best metric here because high intangible assets usually understate a firm’s book value—potentially inflating the firm’s price-to-book measure.
Earnings-related issues for thematics
There is an issue, however, if we use earnings-related metrics (e.g. price-to-earnings (P/E), price-to-next-12-month-earnings, and enterprise value-to-EBITDA). First, negative earnings firms must be removed, resulting in an incomplete exposure being analyzed. And those firms must be removed so as not skew the result (i.e., negative P/E values would tamp down the high P/E values when performing an average calculation for a portfolio).
The presence of negative earnings firms in some thematic exposures means any multiple that has earnings-related information in the denominator should not be utilized. This also holds true for the price-to-earnings-growth ratio (PEG), since it still relies on earnings in the denominator, while normalizing the ratio by expected growth.
No earnings, but revenue, hopefully
While some innovative firms do not have earnings, they likely have sales/revenue. Therefore, using one of these two sales-based metrics may be more optimal: price-to-sales and enterprise value-to-sales. The latter, in my opinion, offers the most appropriate and comprehensive view of a firm’s operations, as enterprise value (EV) accounts for both the firm’s equity value and amount of debt.3 Accounting for the level of leverage/debt utilized by the firm to generate revenue, it tends to be more comparable across industries, given it is capital structure agnostic (i.e., high-debt industries typically look cheaper on a price-to-xyz basis since their debt isn’t captured in the metric, but under EV, the debt is taken into account).
A list of metrics — and the strengths and drawbacks of thematic valuations — are shown below:
The table below compares the different metrics for an aggregated portfolio of all 18 Broad Innovation funds4 with the broad S&P 500. The average figure for the Broad Innovation category is higher than the broad market — as would be expected. However, when it comes to enterprise value-to-sales, the skew is much tighter, due to dynamics discussed above.
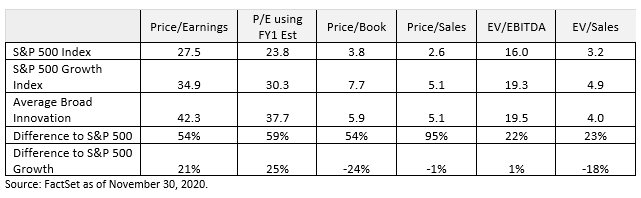
While these exposures were trading rich at the end of last year, the multiples are elevated to the broader market due to higher expected growth estimates and the potential for behavioral changes to create future growth opportunities.
Analysis in 2021 and beyond
The pandemic will continue to spark greater need for innovative technologies that allow for more contactless interactions, advanced medicine, digital connectivity, and intelligent infrastructure.
With more ways to participate in these thematic trends, investors need a classification framework as the first step in due diligence. It’s also important to understand the construction approaches for each exposure. Of all the valuation multiples available, enterprise value-to-sales may be the most appropriate.
Matthew is a Managing Director at State Street Global Advisors and Head of SPDR® Americas Research. He manages a team responsible for the product research and analysis of SPDR ETFs, and the development of market outlooks, investment themes, and portfolio implementation ideas to help clients understand the market landscape and achieve their desired investment outcomes.
1 Bloomberg Finance L.P. as of December 31, 2020, based on SPDR Americas Research calculations.
2 An intangible asset is an asset that is not physical in nature. Goodwill, brand recognition, and intellectual property, such as patents, trademarks, and copyrights, are all intangible assets. Intangible assets exist in opposition to tangible assets, which include land, vehicles, equipment, and inventory.
3 EV is the market capitalization of a company as well as short-term and long-term debt less any cash on the company’s balance sheet.
4 Eighteen funds, as classified by SPDR Americas Research as of December 15, 2020.
Glossary
S&P 500® Index: A popular benchmark for U.S. large-cap equities that includes 500 companies from leading industries and captures approximately 80% coverage of available market capitalization.
S&P 500® Growth Index: A market-capitalization-weighted index developed by Standard and Poor’s consisting of those stocks within the S&P 500 Index that exhibit strong growth characteristics.
Disclosures:
The views expressed in this material are the views of Matthew Barotlini through the period ended February 12, 2021 and are subject to change based on market and other conditions. ...
more

