
How To Use The RSI Technical Indicator To Time Your Marijuana Stock Trades
TM Editors' Note: This article discusses one or more penny stocks and/or microcaps. Such stocks are easily manipulated; do your own careful due diligence.

It’s no secret that marijuana stocks can be volatile at times. However, this volatility can work in your favour and help you produce consistent gains. It all comes down to market timing and patience. Two of the main questions I receive on a weekly basis from friends and colleagues is “when do I sell” and “when do I buy”. Although I will never tell an investor what to do with their money I am happy to tell them how I would play the trade.
They can easily implement my examples into their own trading plan. Speaking of trading plan, it’s very important you have a plan before you enter any trade. Set a range for your entry as well as your exit. One of the biggest mistakes I see is investors not having a plan. Create a plan, stick to it and your trading life will be a lot better.
Now, let’s go over some examples of how I would approach certain trades using a candlestick chart and the relative strength index (RSI) as my main technical indicator. In my opinion, there is no need to load your charts up with a bunch of different indicators. Keep it simple. Now let’s proceed.
The relative strength index or RSI is described by Investopedia as “A momentum indicator that measures the magnitude of recent price changes to evaluate overbought or oversold conditions in the price of a stock or other asset. The RSI is displayed as an oscillator (a line graph that moves between two extremes) and can have a reading from 0 to 100.”
Simply put, if the RSI indicator is showing a reading of 70 or higher it means the stock is in overbought territory and it’s now likely that a pullback or correction is coming soon. This would be an ideal time to take some profits off the table or look to exit entirely and wait for an opportunity to re-enter in the future. In extremely bullish situations that are common with marijuana stocks, you can get an RSI reading of 85 or higher. Normally stocks tend to top out and reverse between 70-80 but marijuana stocks are a different animal and mass hysteria tends to push these stocks to extreme highs and lows.
Exiting a position in multiple trades as the stock is moving higher past the 70 RSI level is one way you can attempt to maximize your exit prices. Remember, it’s ideal to buy on weakness and sell into strength. We are never going to pick the top perfectly so do your best to capture as much as the move as possible but don’t worry if it’s not perfect. Profit is profit. Same goes for buying at the bottom. You will rarely ever call the bottom perfectly either.
If the RSI is showing a reading of 30 or below it means the stock is now in oversold territory and could be considered undervalued. Stocks trading in this oversold range are usually due for a reversal or bounce higher. This would be a great time to enter into a position or add to an existing position. The number 30 should only be used as a gauge. Often times marijuana stocks won’t actually drop below 30 on the RSI. So, any reading in the 30’s or even the low 40’s can still make for a great entry point.
Let’s look at a couple examples of how we can implement this simple RSI strategy into swing trading marijuana stocks. Please note these are just examples and not actual trades we made. We used the lows and highs of each stock to emphasize these examples. Your actual trades may vary. This is just an idea of how to use this strategy in your own trading.
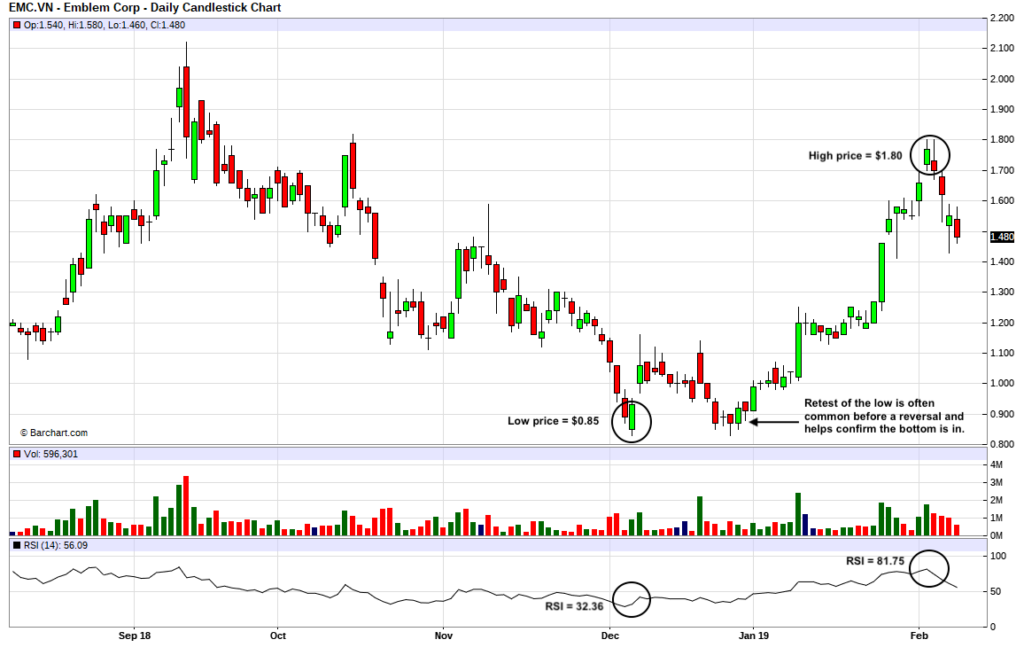
Example Trade #1: Emblem Corp. (TSXV: EMC) (OTCQX: EMMBF)
6 Month Chart
Potential entry point: December 6, 2018
Potential entry price: $0.85 (Open)
Entry RSI: 32.36
Potential exit point: February 4, 2019
Potential exit price: $1.80 (HOD)
Exit RSI: 81.75
Time held: 62 days
Potential ROI: 111.76%
Notes: Normally you won’t be fortunate enough to buy at the absolute bottom and sell at the exact top of any run. Like we said this is just to show the potential of the trade and how to time entries and exits. Even if you bought in during the days leading up to the bottom or the days following and exited in the week surrounding the top you would have done very well.
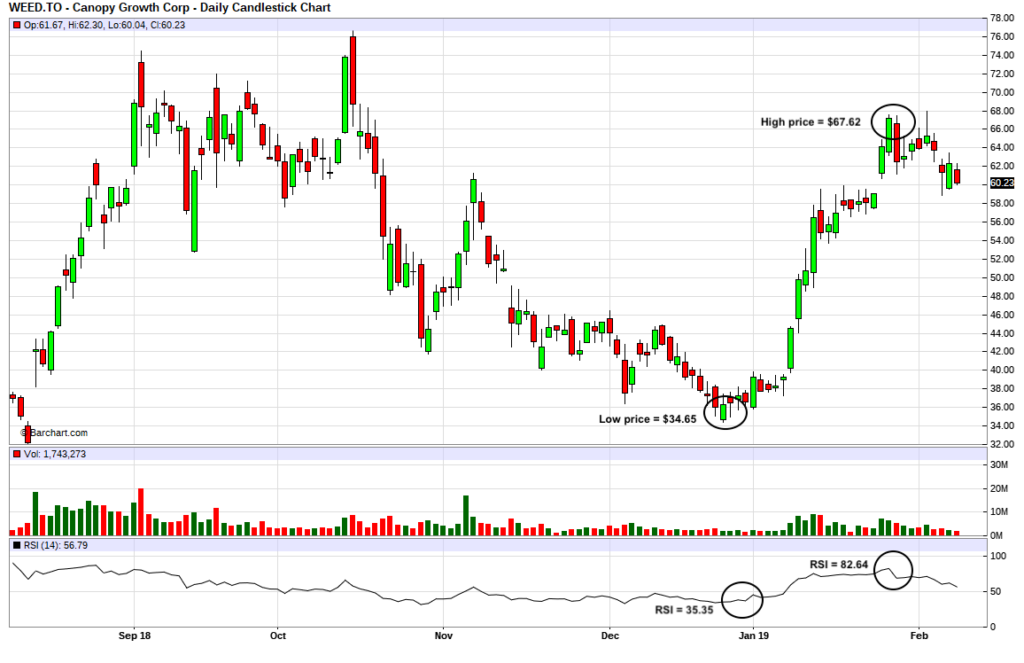
Example Trade #2: Canopy Growth Corp. (TSX: WEED) (NYSE: CGC)
6 Month Chart
Potential entry point: December 24, 2018
Potential entry price: $34.65 (Open)
Entry RSI: 35.35
Potential exit point: January 28, 2019
Potential exit price: $67.62 (HOD)
Exit RSI: 82.64
Time held: 36 days
Potential ROI: 95.18%
Notes: The way this stock confirmed its bottom on this chart is different than the way EMC confirmed its bottom. Although WEED actually made a new low the RSI did not. This is called bullish divergence and is another way to confirm the bottom and increase the odds that reversal in the stock is coming. Bullish divergence is something we plan to cover more in-depth in the future. Stay tuned for that article.
The idea of this strategy is very simple. Get in the habit of looking for solid companies trading in oversold conditions while other traders are fearful and selling out. Then hold those positions until the RSI reaches the 70’s and 80’s and look to make your exits. Selling into the mass euphoria when the RSI is nearly maxed out is often the way to go. Even if you think the stock price is going higher, remember, the RSI never lies.
Well, there you have it folks. We hope this was informative and that you can implement this into your own trading strategies moving forward. We realize this is pretty basic stuff but for some the less experienced traders, this simple strategy can work wonders for knowing the best times to enter and exit trades. Sometimes keeping it simple can be the best way to go.
Image source: Shutterstock
Chart source: Barchart
I have not been compensated for this article and hold no positions in any companies mentioned.


Good stuff, thanks!