
How To Interpret The Surge In Google Trends For "Recession" Searches
We did not know it at the time, but an official recession began in January 2008 according to the economists who declare such things. I took a look back at some signals surrounding this time because last month (August 2019) Google searches on the term "recession" soared to levels last seen during the financial crisis.
(Click on image to enlarge)
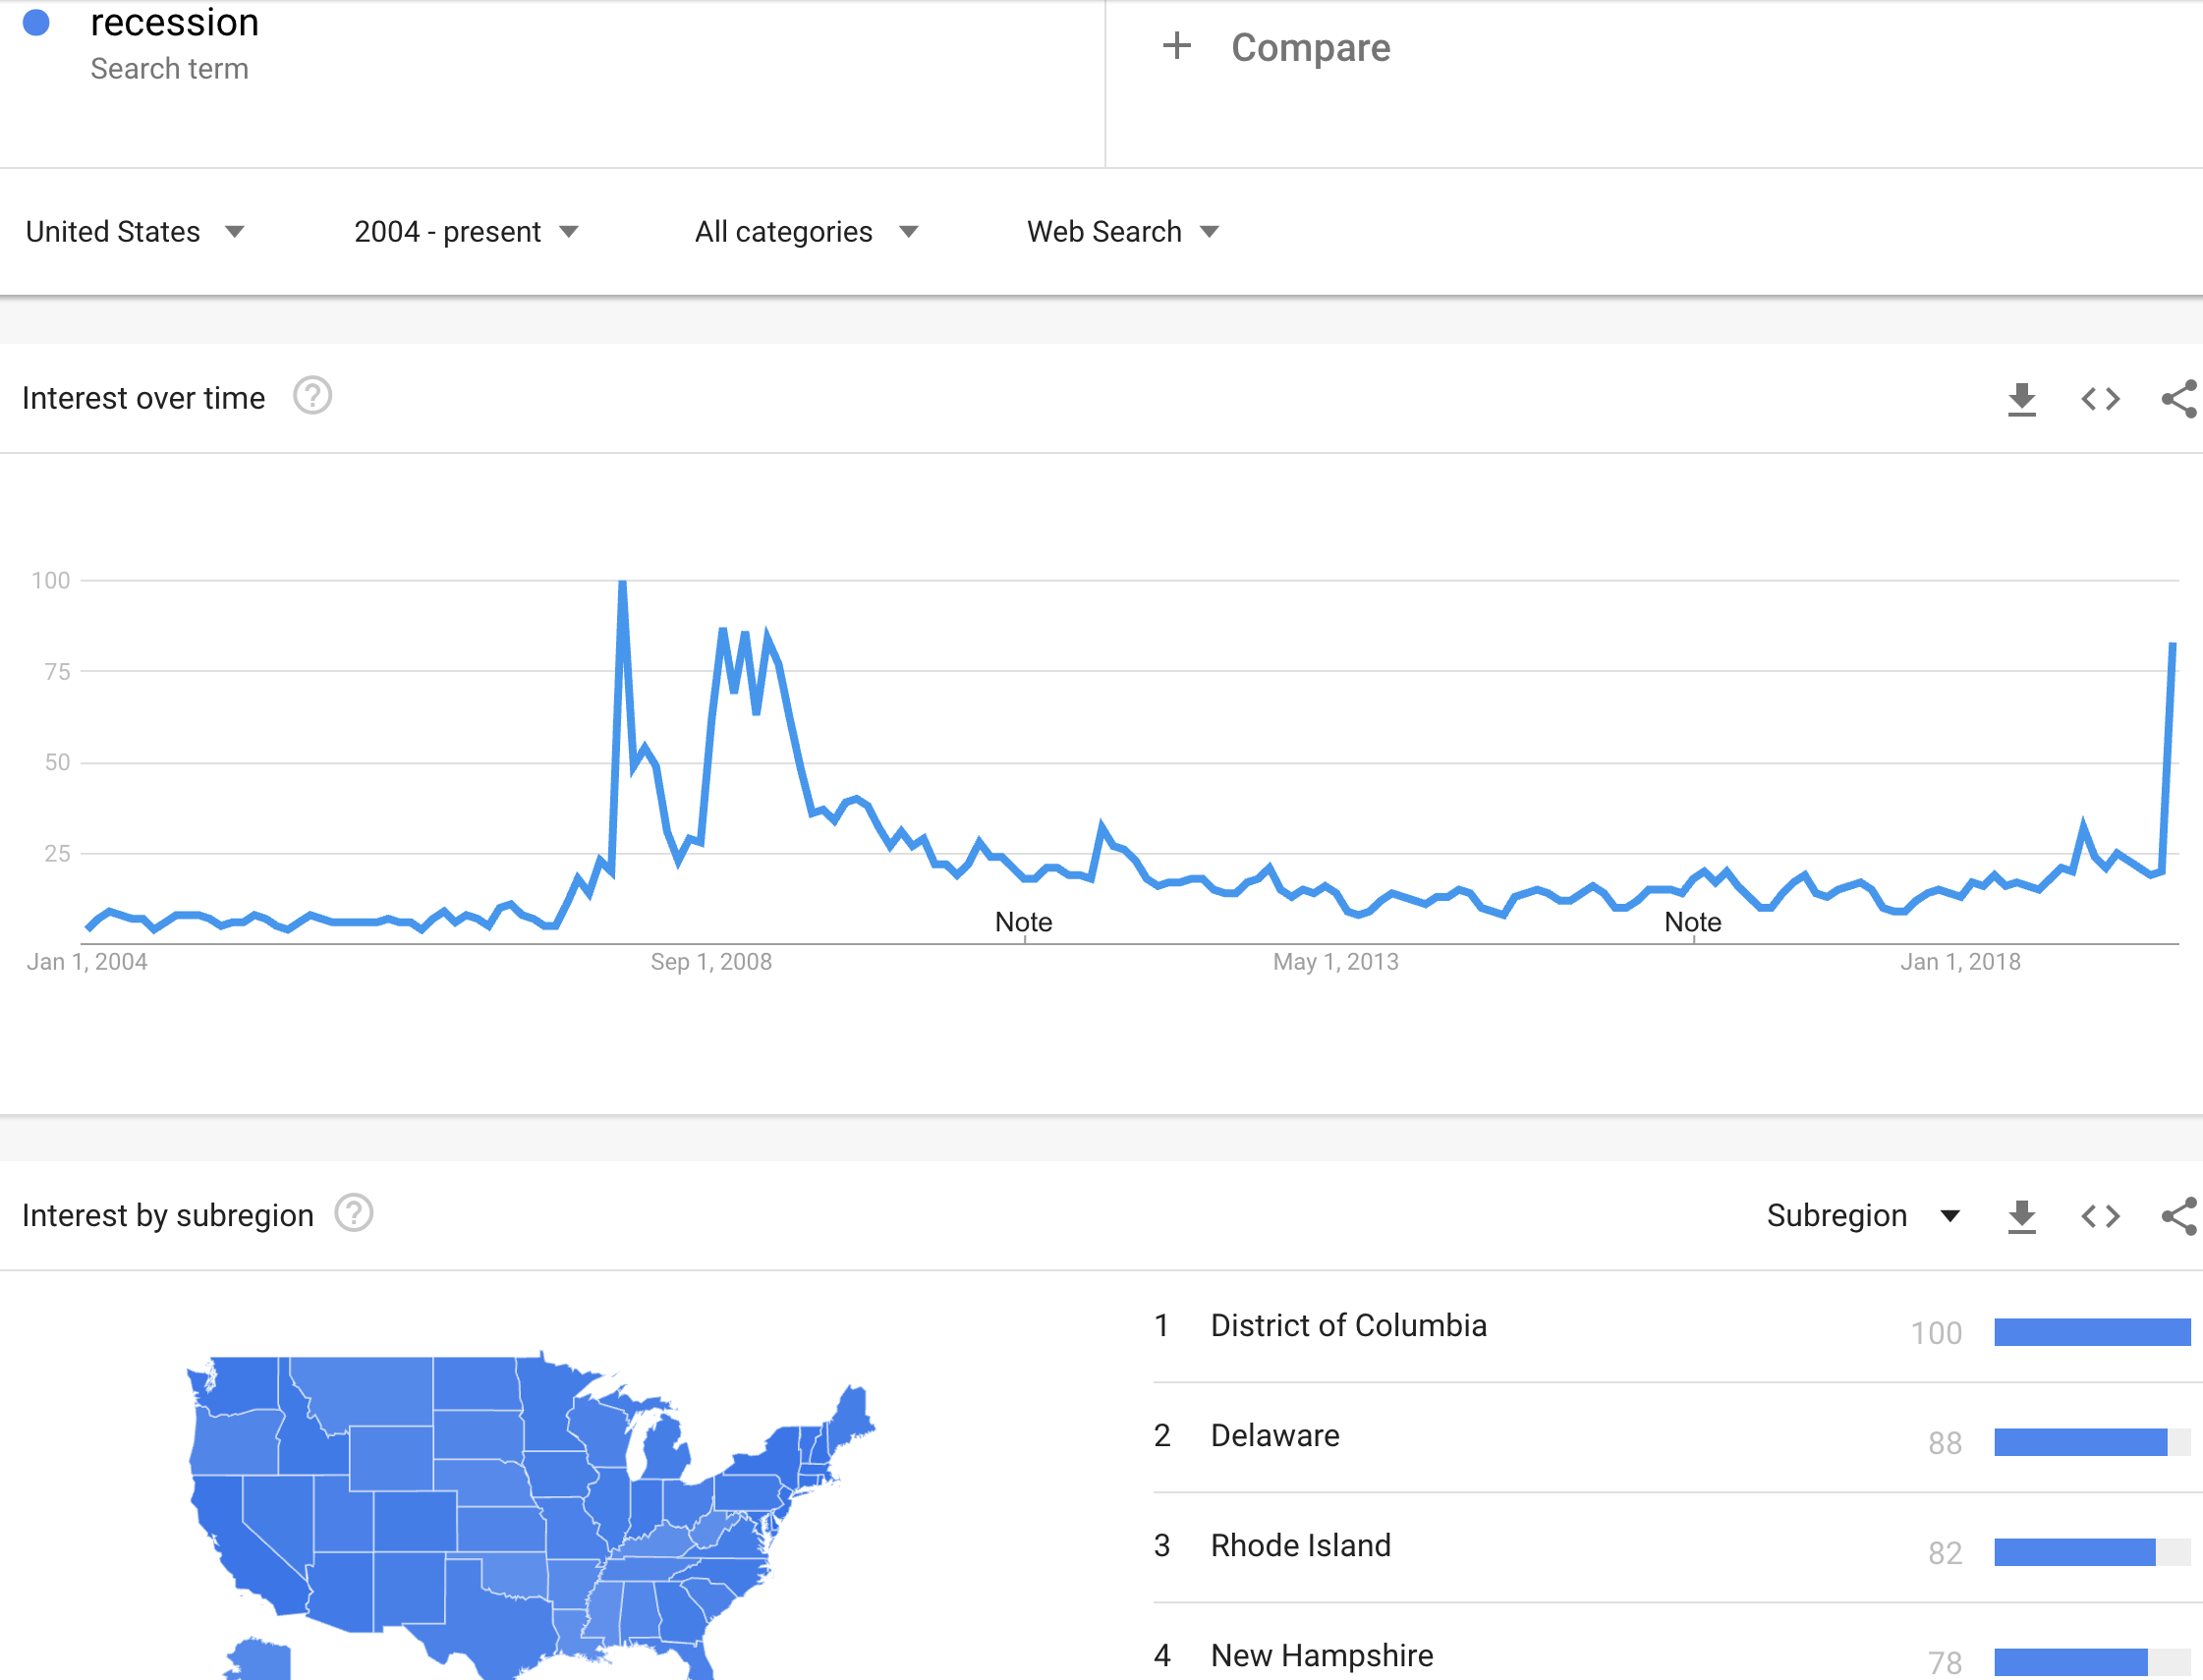
Seeing Washington D.C. lead the country (on a relative basis) in recession searches is quite telling: are people involved with the Federal government more concerned about the prospects of a recession than they are letting on? Regardless, the dynamics of Google searches during the last recession may provide guidelines for interpreting this current spike. Google searches on the term "recession" spiked to an all-time high (that still holds) right in January 2008. Recession searches (fears) seemed to recede quickly from there but never returned to the baseline. Apparently, the collapse of Lehman Brothers in September 2008 was the catalyst for sending recession searches soaring again. By that time, the notion of a recession was almost fully accepted even if not yet officially declared, and the Federal Reserve soon went into all-out emergency mode followed by a reluctant Federal Government.
So one potential way to interpret Google Trends is to see whether and how quickly searches on "recession" move toward the baseline. If the searches remain elevated, I will assume recession odds also remain elevated. A fresh spike, or perhaps even continued high levels of searches, should all but confirm the onset of a recession...especially if these searches are still led by Washington D.C.!
Fresh talk of yield curve inversion and the chaos of an accelerating U.S. versus China Trade War are two salient catalysts for recession fears. Interestingly, the last yield curve inversion was already long over by the time of the official recession (I discuss these dynamics more fully in "How to Understand the Inverted Yield Curve and Its Relationship to Recessions"). That inversion by itself was also clearly not enough to get the Google searches going for "recession".
(Click on image to enlarge)
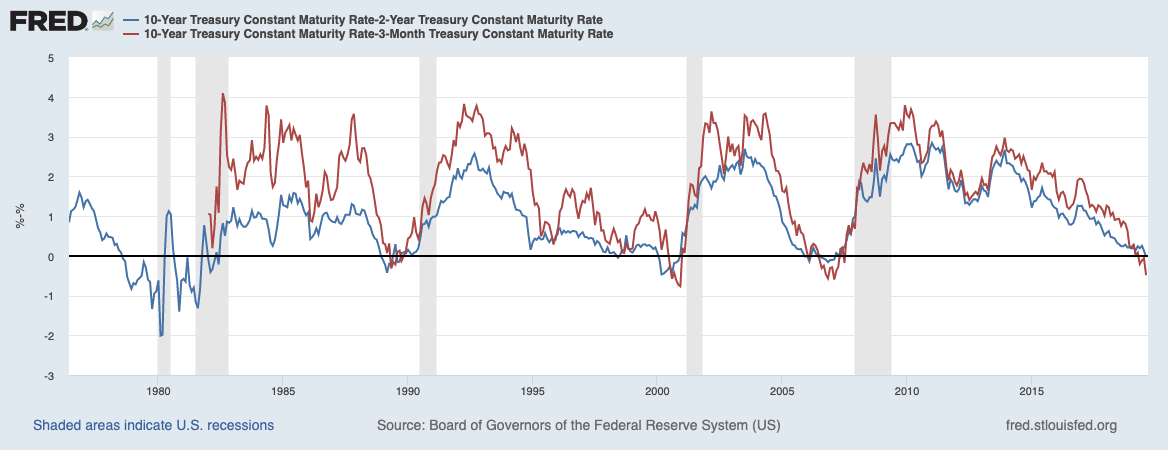
10-Year Treasury Constant Maturity Rate [DGS10], retrieved from FRED, Federal Reserve Bank of St. Louis; September 2, 2019. (I also saved the combined chart here).
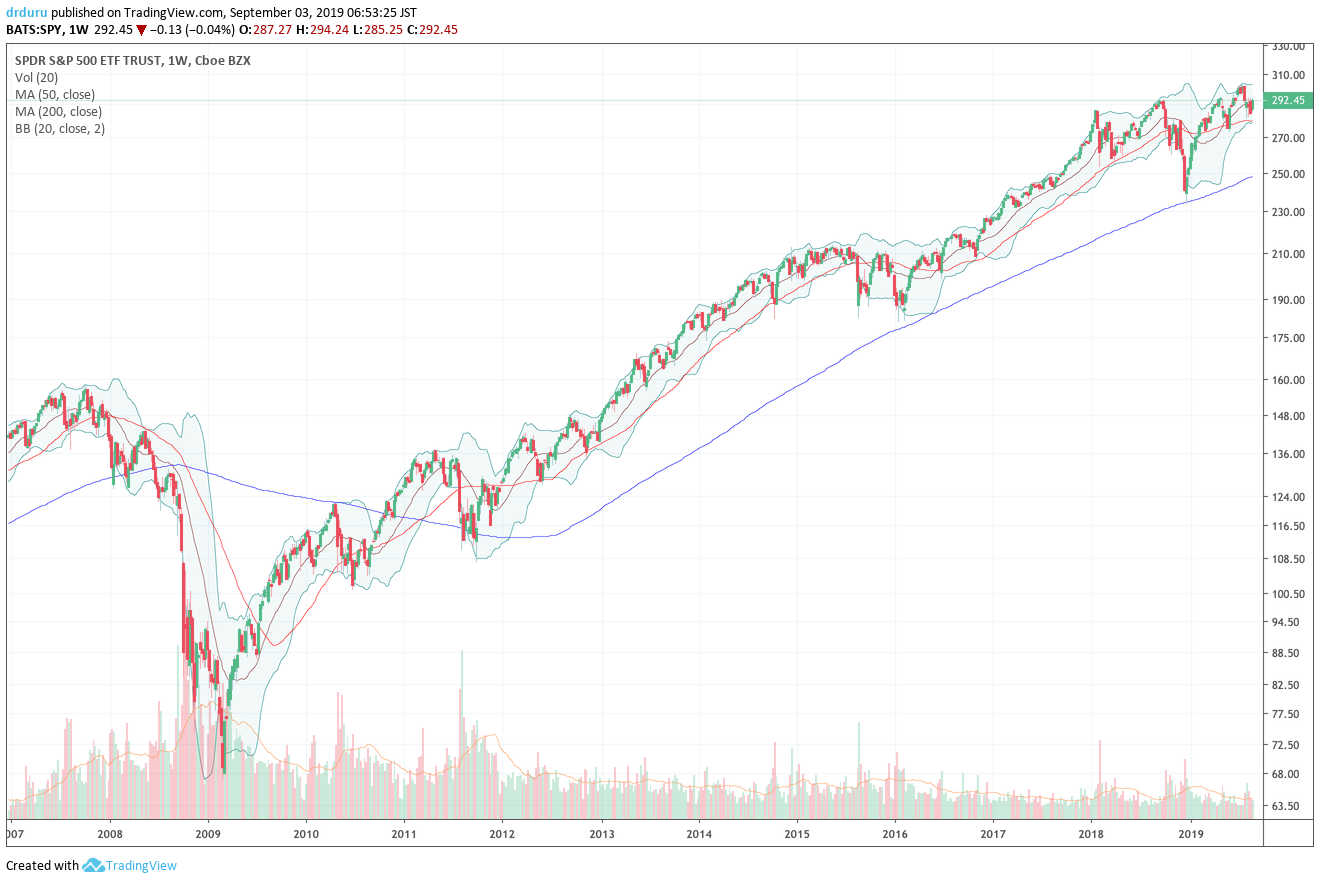
Google search data is of course very limited for this kind of assessment, but if the last recession is any indication then the current spike in recession searches may actually have little to do with the yield curve inversion. The dynamics of the yield curve are hard to understand and so many counter-opinions exist to throw doubt into its usefulness. Something else has people bothered and perhaps that is the Trade War and the accompanying global economic slowdown itself. I cover more details about the rising alarm bells surrounding the Trade War in "Trade War Realities Weigh More Heavily." I also doubt the stock market itself is a driver. The S&P 500 (SPY) is only about 3.3% off its all-time high. In January 2018, the S&P 500 was in the middle of a sharp breakdown from a double-top formed by all-time highs in July and October 2017 (the stock market can be so stubborn!).
(Click on image to enlarge)
Be careful out there!


Great read.
Yes, excellent.