
How To Find High-Quality Stocks With Big Cash Distributions
Investing in solid companies with reasonable valuations can be a simple and effective investment strategy for superior returns. Even better, if the company is distributing lots of cash to investors via dividends and buybacks, this provides an additional reason to buy the stock.
A Quantitative Strategy That Makes Sense
Dividends and buybacks say a lot about the fundamental health of a business. If management is consistently returning cash to investors, then the company is generating more cash than it needs to retain, which is a clear sign of underlying fundamental health.
But buybacks can be either value-creating or value-destroying depending on the particular case. At the end of the day, a company that repurchases stock is essentially investing in its own shares. If the stock is undervalued and business prospects are solid, then the company is investing its resources in a compelling investment, meaning its own stock.
Alternatively, if the stock is overvalued or the fundamentals are deteriorating, a stock buyback program from such a company would make things even worse for investors since the company is allocating its capital to an investment with mediocre potential.
In simple terms, if the stock is cheap and the business is solid, then the investment case is quite strong, and buybacks make the investment case even stronger.
The following strategy is an attempt to find those kinds of stocks via a combination of factors. The strategy parameters are as follows:
- Return on Assets (ROA) has to be above 5%. This is in order to include companies that are not only generating positive earnings but also strong profitability on the company's asset base.
- Price to free cash flow has to be below 20. The parameter is not very demanding in terms of valuation, but it's mostly intended to avoid stocks trading at excessively high prices in comparison to cash flows.
- The company must have repurchased at least 5% of its shares outstanding in the past year. We are looking for companies that are delivering substantial reductions in the number of shares outstanding, not just repurchasing stock to compensate for the issuing of new shares.
- Among the companies that meet the criteria above, the strategy buys the 20 stocks with the biggest amount of capital distributions via dividends and buybacks as a percentage of market capitalization.
The main idea is actually quite simple, we are looking to buy companies that are solidly profitable, not too expensive, and making big cash distributions to investors.
Backtested Performance
The following backtest excludes over-the-counter stocks from the investable universe and it builds an equally weighted portfolio with the 20 stocks selected by the quantitative strategy. The portfolio is rebalanced every four weeks, trading expenses are assumed to be 0.2%, and the benchmark is the SPDR S&P 500 (SPY) ETF.
Since January of 1999, the strategy gained 1309.1%, far surpassing the 240.9% produced by SPDR S&P 500 in the same period. Alpha for the quantitative strategy amounts to 8.56% per year.
(Click on image to enlarge)
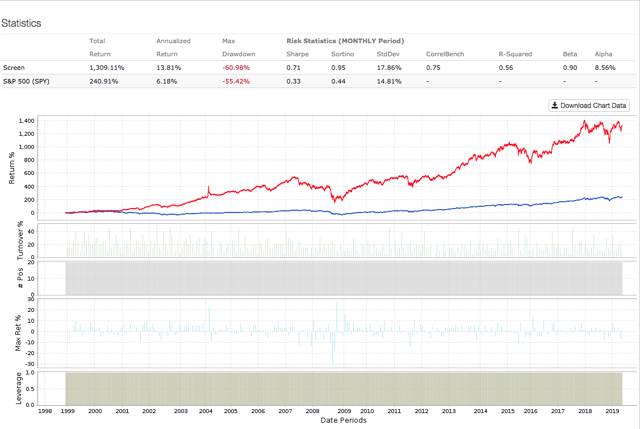
Data from S&P Global via Portfolio123
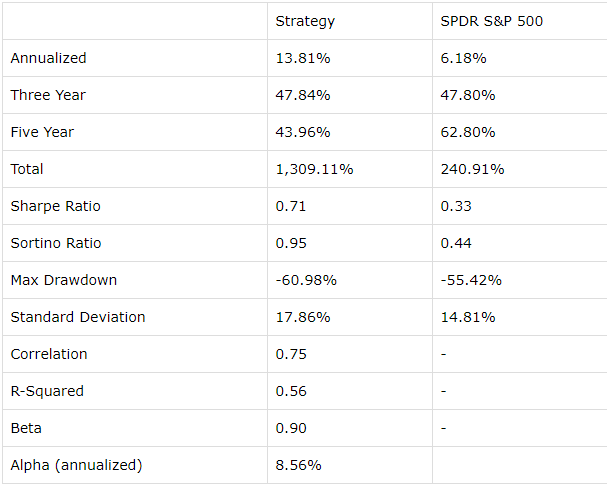
Looking at the data in more detail, there are some important considerations to keep in mind. The strategy outperforms by a wide margin over the past two decades and also in the past three years. But the strategy underperforms the benchmark in the past five years.
This is perfectly normal and even to be expected. No strategy of any kind - quantitative or discretionary - can outperform the market year after year. If we look at market performance in the past five years, growth stocks with relatively expensive valuations have done particularly well, so the quantitative strategy has lagged the benchmark.
(Click on image to enlarge)
Practical Considerations And Portfolio
The quantitative strategy above does not include any criteria for sector diversification, so it's clearly not intended to provide a complete portfolio solution. The main idea is not that investors should replicate the quantitative strategy, but rather use it as a source of potential ideas for further research.
It's important to keep in mind that a quantitative strategy such as this one is based on current data for variables like profitability, valuation, and cash distributions. Investors need to make sure that the company is strong enough to sustain those metrics in the future when analyzing any of the ideas from the quantitative strategy. In other words, you need to evaluate the business behind the numbers in order to tell if the numbers are sustainable or not.
Investors should also keep in mind that the companies in the strategy often have above-average volatility. The strategy outperforms the benchmark in terms of risk-adjusted returns over the long term, meaning that the increase in returns more than compensates for the higher volatility. However, the fact that the strategy is more volatile than the benchmark deserves to be acknowledged.
Without further prologue, the table shows the 20 stocks currently selected by the strategy. Data in the table also includes market capitalization - in millions - as well as return on assets, price to free cash flow, and the change in the number of shares outstanding over the past year.
Without further prologue, the table shows the 20 stocks currently selected by the strategy. Data in the table also includes market capitalization - in millions - as well as return on assets, price to free cash flow, and the change in the number of shares outstanding over the past year.
| Ticker | Name | MktCap | ROA | P/FCF | Shares Change |
| AAPL | Apple Inc. | $893,306 | 16.12 | 19.97 | -7% |
| ALSN | Allison Transmission | $5,524 | 15.14 | 8.11 | -10% |
| AMAT | Applied Materials Inc. | $37,912 | 18.71 | 19.01 | -9% |
| AMGN | Amgen Inc. | $109,603 | 11.95 | 17.84 | -11% |
| APT | Alpha Pro Tech Ltd. | $47 | 12.11 | 19.72 | -7% |
| ARCH | Arch Coal Inc. | $1,514 | 16.94 | 5.92 | -15% |
| AZO | AutoZone Inc. | $27,672 | 15.23 | 17.82 | -7% |
| CELG | Celgene Corp. | $68,577 | 13.14 | 10.52 | -9% |
| CRUS | Cirrus Logic Inc. | $2,358 | 6.47 | 13.75 | -7% |
| EBAY | eBay Inc. | $34,173 | 11.27 | 18.52 | -9% |
| GBL | Gamco Investors Inc. | $550 | 80.99 | 5.91 | -6% |
| HDS | HD Supply Holdings Inc. | $6,736 | 8.95 | 14.76 | -6% |
| LRCX | Lam Research Corp. | $25,857 | 20.11 | 12.96 | -7% |
| MEOH | Methanex Corp. | $3,463 | 9 | 6.1 | -7% |
| MGA | Magna International Inc. | $14,911 | 9.96 | 9.28 | -8% |
| NRP | Natural Resource Partners | $466 | 9.91 | 5.32 | -8% |
| SPR | Spirit AeroSystems | $8,358 | 11.22 | 15.76 | -8% |
| TOL | Toll Brothers Inc. | $5,478 | 7.41 | 8.75 | -8% |
| TXT | Textron Inc. | $11,465 | 8.23 | 19.25 | -7% |
| WDR | Waddell & Reed | $1,255 | 13.51 | 6.14 | -5% |
Disclosure: I am/we are long LRCX. I wrote this article myself, and it expresses my own opinions.
Disclaimer: I wrote this article myself, and it expresses my own opinions. I am not ...
more

