
How The Fed Created The Ultimate Paradox: Stocks At All-Time Highs With No Liquidity And Soaring Realized Vol
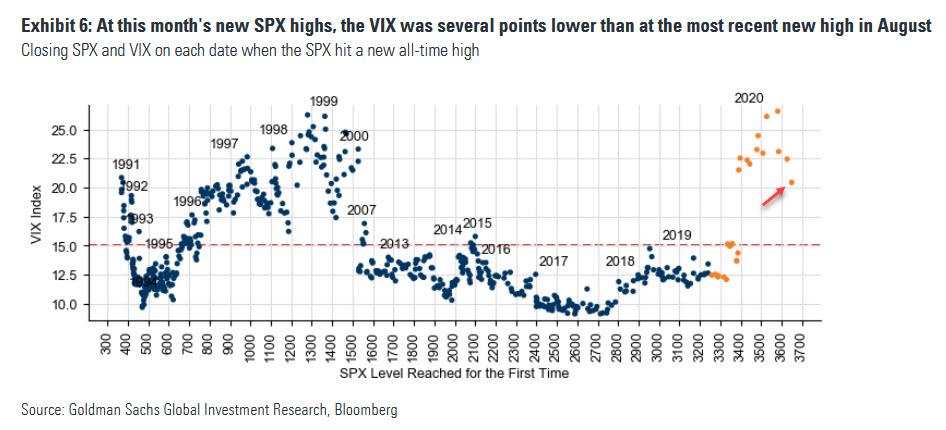
For the entire duration of the record rally since the March "pandemic shutdown" lows, which has pushed the S&P to all time highs, there has been something off about the market: virtually every new all-time high in spoos took place at a level of the VIX that was also a new all time high. This is a paradox: traditionally, a rising VIX (i.e., higher implied vol and a willingness by traders to pay more for downside protection) means a growing sense of apprehension about the future, and yet that has not been the case since March, in fact quite the contrary - the higher the VIX rose, the higher the S&P moved as well, prompting many veteran traders to scratch their heads.
As shown in the chart below, the vol-SPX spot correlation clearly shifted to a new regime in the aftermath of the Covid crash (Q2 2020 and onward).
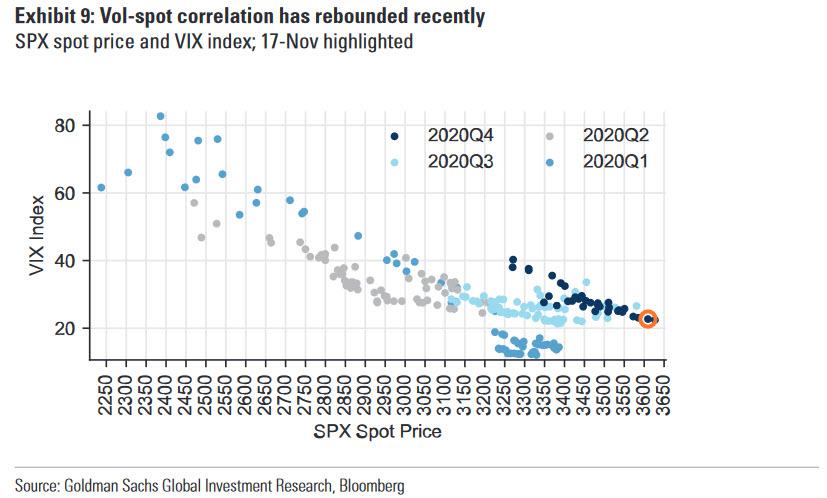
And only recently did the S&P breakout to its latest record highs see the VIX decline, although at 21 the VIX is still far above the average level the VIX traded at when the SPX hit new record highs.
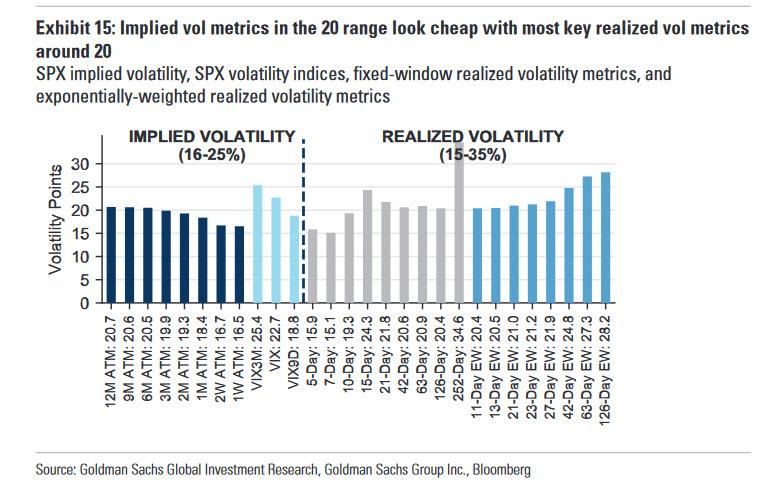
Yet while implied vol has been surprisingly high - if finally drifting lower now - realized vol has been even higher and stickier.
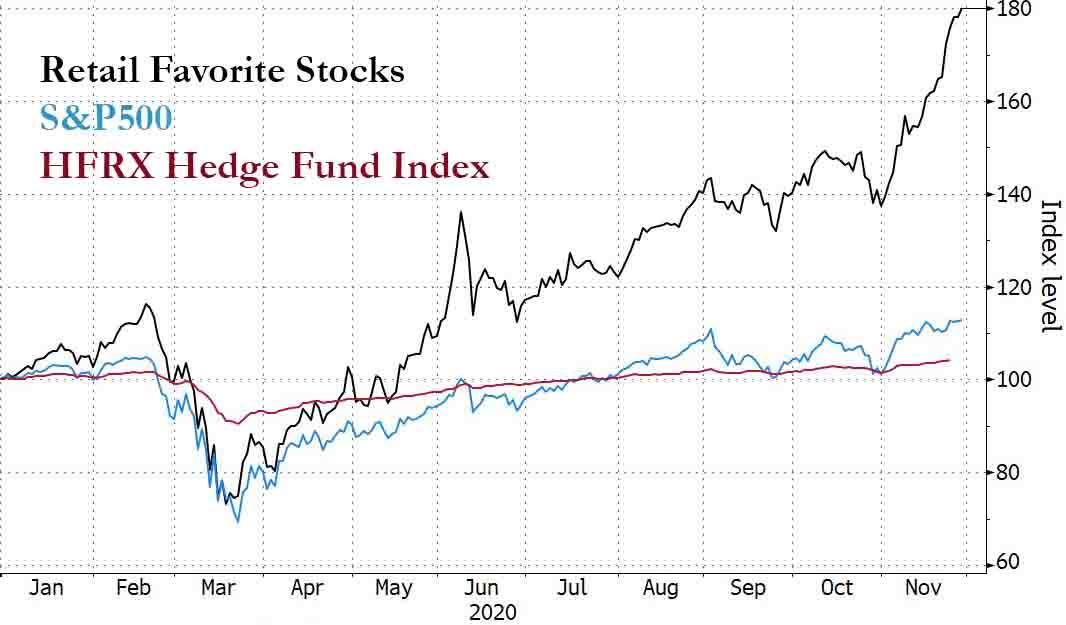
This is just one of the countless dislocations pointed out by traders, at least those older than 16 (who are currently generating 80%+ returns on Robinhood and outperforming hedge funds 20-to-1).
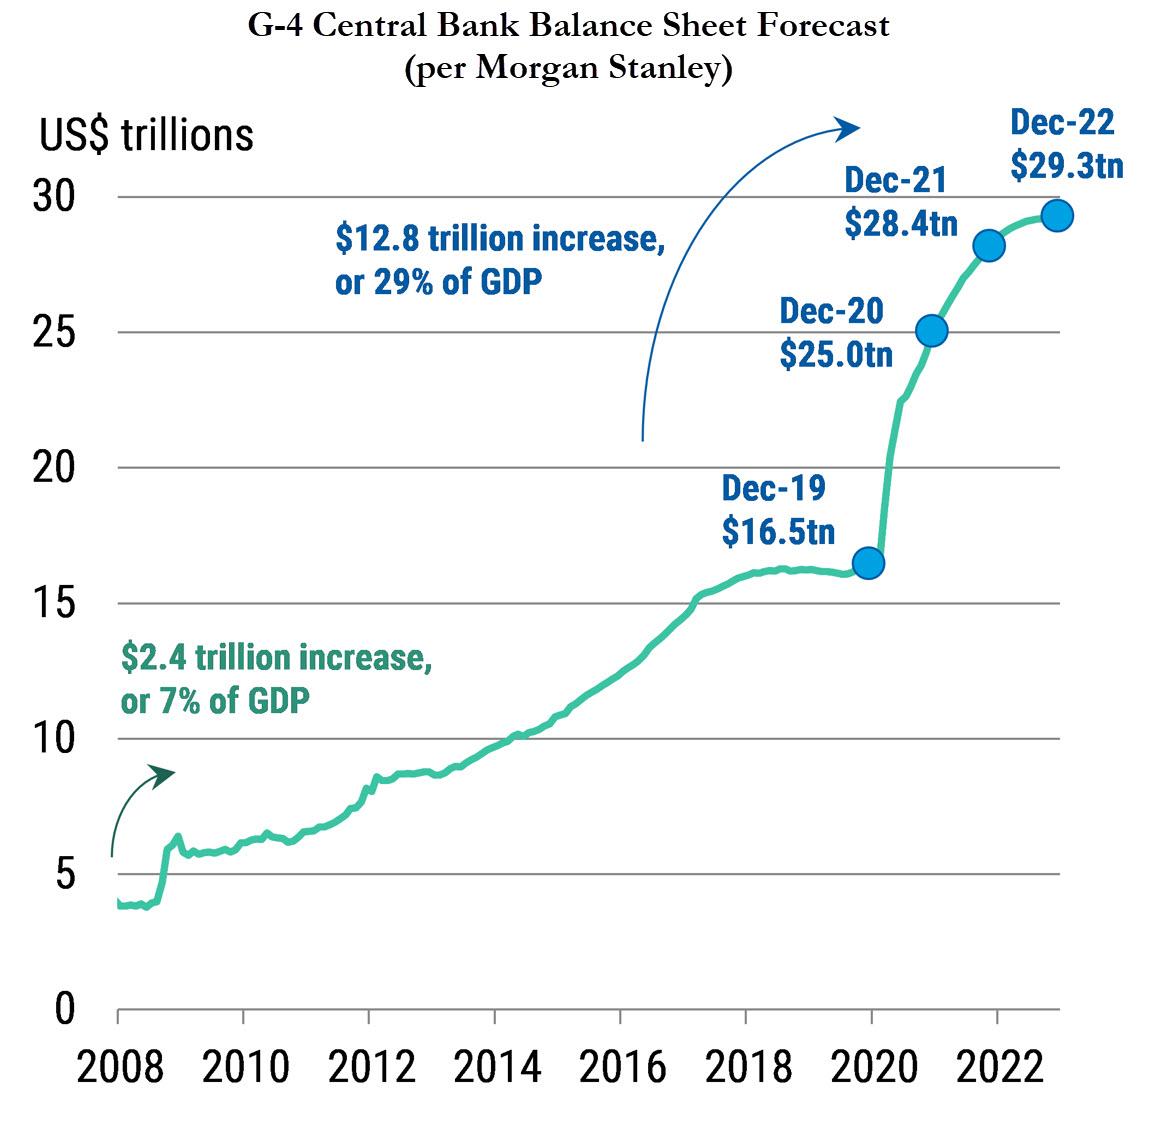
As usual the root cause can be found in two familiar culprits: the soaring balance sheet of central banks which have crushed price discovery as they now add 0.7% of global GDP in liquidity every single month.
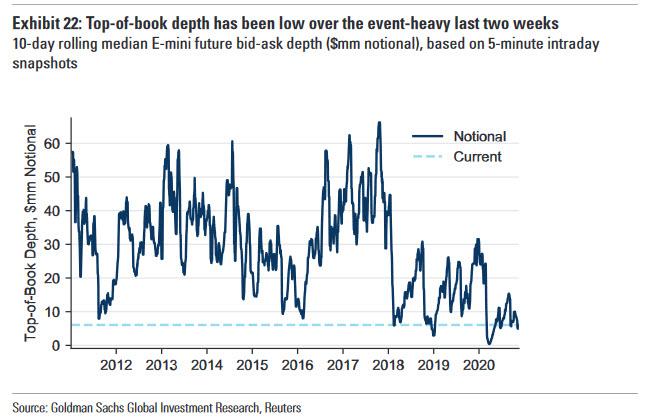
And linked to that, the ongoing obliteration of equity liquidity, which means that even odd-lot orders can now push the market at will.
Now, thanks to SocGen strategist Sandrine Ungari, we can show the direct link between central bank market intervention, the resulting lack of market liquidity and the surprisingly high - and sticky - realized volatility. As Ungari writes, "the availability or scarcity of liquidity in the most liquid markets is becoming one of the determinants of realized volatility."
In a recent lengthy research report titled "Electronic markets under the microscope", Ungari looks at the Covid crisis, where we notes that we have seen a feedback loop, or liquidity cascade which can be summarized as follows: "uncertainty depresses the willingness of market markers to provide liquidity, and liquidity droughts maintain a high level of realized volatility" (a topic we have discussed here on countless occasions over the past decade, and which was summarized effectively for recent market entrants in a recent note on "Liquidity Cascades" from Newfound Research).
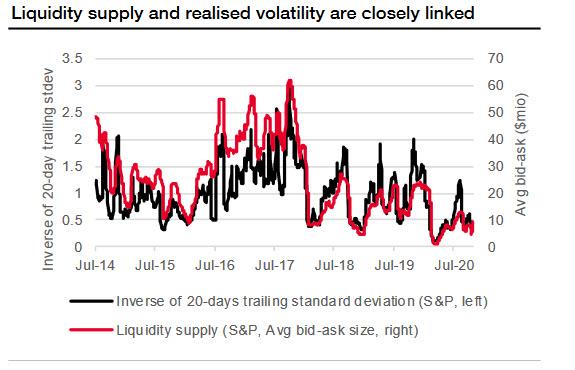
This effect becomes obvious when looking at liquidity supply versus the inverse of realized market volatility. Liquidity supply here is measured as the average bid and ask sizes from first limit quotes, similar to the Goldman chart above looking at e-mini top-of-book bid-ask depth (or lack thereof) and is broadly a proxy for the average liquidity available in the equity market at any one moment.
What it shows is that in March 2020, during the depths of the Covid crash and subsequent Fed nationalization of the bond market, realized volatility reached historical levels that had not been seen since 2008 as the supply from liquidity providers collapsed.
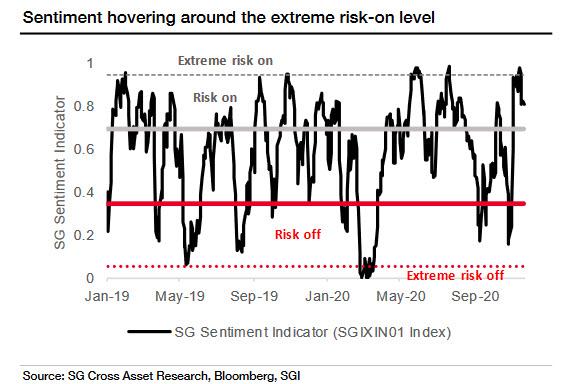
And here the Fed-created paradox emerges: while trader sentiment in the aftermath of the Pfizer Covid vaccine news - which pushed the S&P 500 up 7.5%, Europe's STOXX 600 up 12%, European value stocks 20% higher and high-yield credit spreads tighter by almost 80bp - is at a "risk on" extreme liquidity supply remains virtually non-existent and is at the bottom of the range since the start of SocGen's dataset in 2014 and in line with the levels of realized volatility which as noted above are not only surprisingly high, but are even above where they should be based on the stubbornly high VIX.
The surprisingly clear - and inverted - relationship between market liquidity and realized vol is shown in the chart below:
As SocGen concludes, at current levels, "markets are well inflated, while economies will need a few more months to absorb the second lockdown consequences." This means that "the path to normality is probably going to be a long one, with bumps along the way. Liquidity is most likely to become, once again a topic of concern."
And when it does, sparking another market selloff, the Fed will inject even more liquidity, leading to even less market liquidity until eventually we reach the inevitable singularity where the Fed's latest "bailout" will mean there is no liquidity at all left in the what was once known as "the market."
Disclaimer: Copyright ©2009-2020 ZeroHedge.com/ABC Media, LTD; All Rights Reserved. Zero Hedge is intended for Mature Audiences. Familiarize yourself with our legal and use policies every time ...
more

