
Honda Vs. Toyota Ahead Of Earnings
When it comes to car sales in the United States, Toyota (TM) and Honda (HMC) are the top two foreign manufacturers in terms of sales. Ford is the top seller, Toyota is second, Chevy is third, and Honda is fourth in terms of all companies. The friendly rivalry between Honda and Toyota goes back many decades and it goes back to their early days in Japan. Now the two rivals are set to report fiscal Q4 results within days of one another. Toyota is set to report on May 12 and Honda will report on May 14.
If we break down the two stocks using all three analysis styles, I believe there is a clear winner, but it’s a close race.
Starting with the fundamental analysis and using the Tickeron fundamental analysis screener, Toyota gets positive marks in five categories and one negative mark. Honda gets three positive marks and two negative marks.
The positive marks for Toyota are the valuation rating, the profit vs. risk rating, the SMR rating, the P/E growth rating, and the seasonality score. The lone negative mark is the outlook rating.
(Click on image to enlarge)
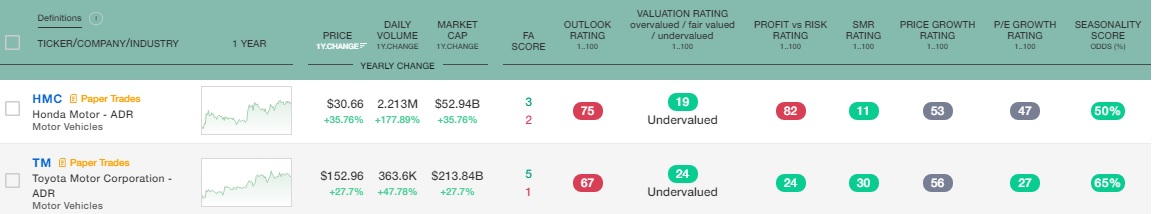
Honda gets positive scores for its valuation rating, the SMR rating, and the seasonality score. The negative scores are in the outlook rating and the profit vs. risk rating.
Honda did post better earnings growth in Q3 with a jump of 161%, but it has seen earnings decline by 28% per year over the last three years. Toyota saw earnings increase by 57% and over the last three years the EPS has declined by an average of 16% per year. Honda’s earnings are expected to increase by 12% for 2021 as a whole while Toyota’s are expected to increase by 11%.
Toyota’s sales increased by 13% in the third quarter while Honda’s only increased by 6%. Over the last three years, Honda’s sales have declined by 4% per year while Toyota’s have declined by only 2% per year.
In terms of the profitability measurements, neither company gets great scores, but Toyota has better measurements on both its return on equity and its profit margin. The ROE is 9.1% compared to Honda’s 5.7%. Toyota’s profit margin is 8.5% and Honda’s is only 5.3%.
Looking at all of the fundamental ratings, Toyota scores better in profitability ratings, earnings and revenue growth over the last three years, and sales growth in the third quarter. The one area where Honda scores better is in earnings growth in the third quarter.
Both Stocks Have Lagged the Overall Market Since the March ’20 Low
Turning our attention to the technical analysis for Honda and Toyota, the first thing I noticed on the weekly charts is that both stocks have underperformed the S&P since the low in Marcy 2020. Since March 23, 2020, the S&P has gained over 87%. Honda has gained 54% during the same time period and Toyota is up 37%.
Even though Toyota has lagged the market even more than Honda, I like the current setup better. We see on the weekly chart that a trend channel has formed over the last 14 months and the stock is trading just above the lower rail of the channel.
(Click on image to enlarge)
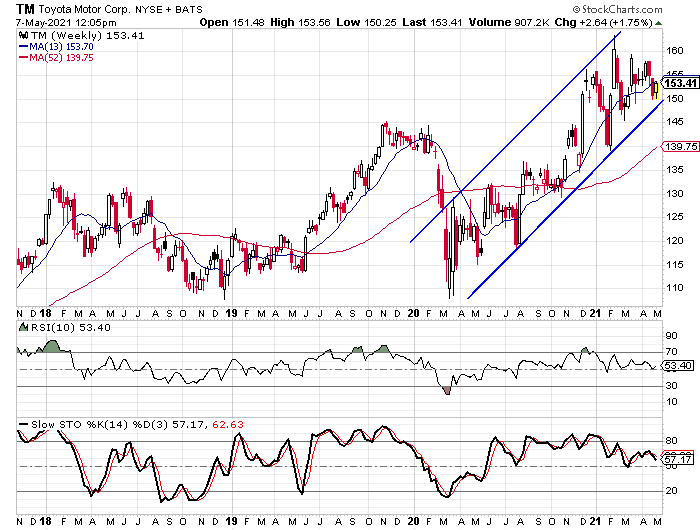
The overbought/oversold indicators are just above the 5o level at this time and that seems to be an area that is important for both indicators. The 10-week RSI has only been below the 50 level one time since last July. The stochastic indicators haven’t been below the 50 mark since moving above it last May and they have made turnarounds right at that level on two occasions.
Honda’s weekly chart shows an upward trend, but the pattern doesn’t seem to be as organized as what we see on Toyota’s chart. The only real discernible trend line is the low from last March connecting to the low last fall. That trend line is approximately 13% below the current price.
(Click on image to enlarge)
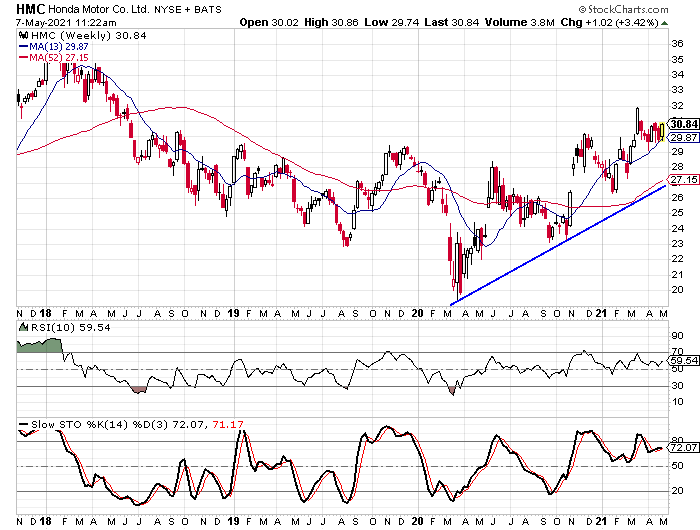
The OB/OS indicators for Honda are noticeably higher than Toyota’s, especially the stochastic indicators. The key levels on Honda’s indicators aren’t nearly as clear as they are for Toyota and that is a concern as well.
Like we saw with the fundamental analysis, I would give Toyota the advantage on the current technical analysis as well.
The Sentiment Indicators are Very Similar
The final piece of the analysis shows very similar readings on the sentiment indicators, but once again there is a slight advantage. Toyota has 20 analysts covering it with 14 “buy” ratings and six “hold” ratings. Honda has 17 analysts covering it and it also has 14 “buy” ratings. The other three analysts rate Honda as a “hold”. This puts Toyota’s buy percentage at 70% and Honda’s at 82.4%. The average buy percentage falls in the 65% to 75% range so Toyota is in the average range and Honda is above average.
The short interest ratios for the two stocks are as close as you can get and both are slightly below average. Toyota’s ratio is 2.5 and Honda’s is 2.4. The average short interest ratio is normally in the 3.0 range, but since the big short squeezes occurred earlier this year, the average does seem to be a little lower than the historical average.
One thing to keep in mind about the sentiment indicators is that I view them from a contrarian perspective. The higher buy percentage for Honda isn’t a good thing because it means there is a greater chance for downgrades. Neither of the short interest ratios is so low that they are a real concern, but I also wouldn’t count on a short-covering rally for either stock.
Taking all three analysis styles into account, I have to believe that Toyota will outperform Honda over the next three to six months. Toyota has a slight advantage in the fundamentals, the chart looks like the stock is closer to a buy point than what I see with Honda, and there is the slight advantage on the sentiment indicators.
Disclaimer: Although our services incorporate historical financial information, past financial performance is not a guarantee or indicator of future results. Moreover, although we believe the ...
more

