
Homebuilders Still Cruising
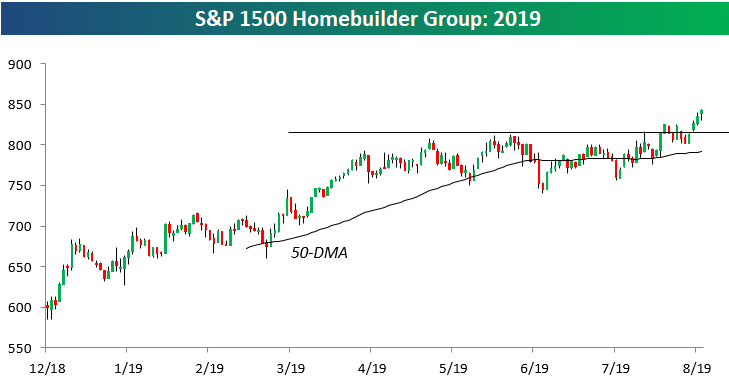
The S&P 1500 Homebuilder group has had a great 2019 as mortgage rates have fallen over 100 bps from their highs in late 2018. As shown below, the group just recently broke out to new 2019 highs after a 3-month sideways period, and as of this morning, it was up 40% year-to-date.
(Click on image to enlarge)
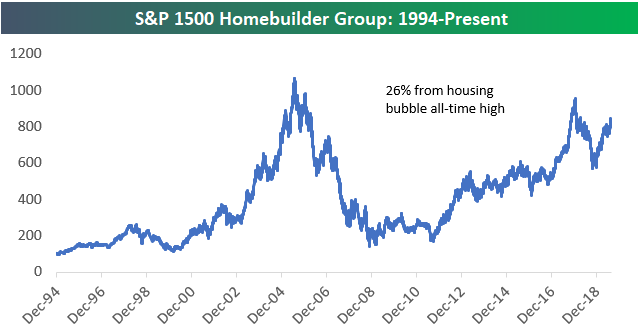
While 2019 has been a great year for homebuilders, remember that the group had a terrible 2018. As shown below, the group actually hit its peak of the current cycle in January 2018 when it actually got relatively close to its housing bubble highs from 2005. From high to low in 2018, however, the group was down 40%. That’s how you get a 40% YTD gain in 2019 without managing to re-take 2018 highs. At current levels, the homebuilders are roughly 26% from their bubble highs made in mid-2005.
(Click on image to enlarge)
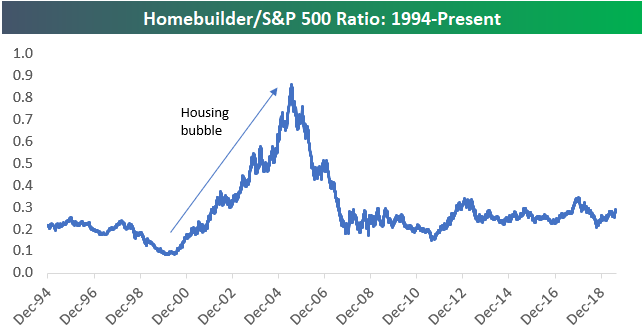
In an earlier post today, we looked at the ratio of the Nasdaq 100 to the S&P 500. While the Nasdaq has outperformed the S&P 500 by a wide margin throughout the current bull market, the homebuilders have basically traded back and forth with the S&P for the last 10 years with periods of ups and downs. From a relative strength perspective, the homebuilders are nowhere close to recovering the gains they made versus the S&P during the housing bubble.
(Click on image to enlarge)
Start a two-week free trial to one of Bespoke’s premium equity market research services.
Disclaimer: Read ...
more

