
High Number Of Record Highs
Major US equity indices have returned to all-time highs in the second half of October with the S&P 500 and Dow both hitting record levels today. Meanwhile, the Nasdaq Composite is roughly a quarter of one percent away and the closest to a new all-time high since the last one on September 7th. The Russell 2,000, on the other hand, is at the high end of the past several months’ range, but it is still over 2% below its high from March 15th.
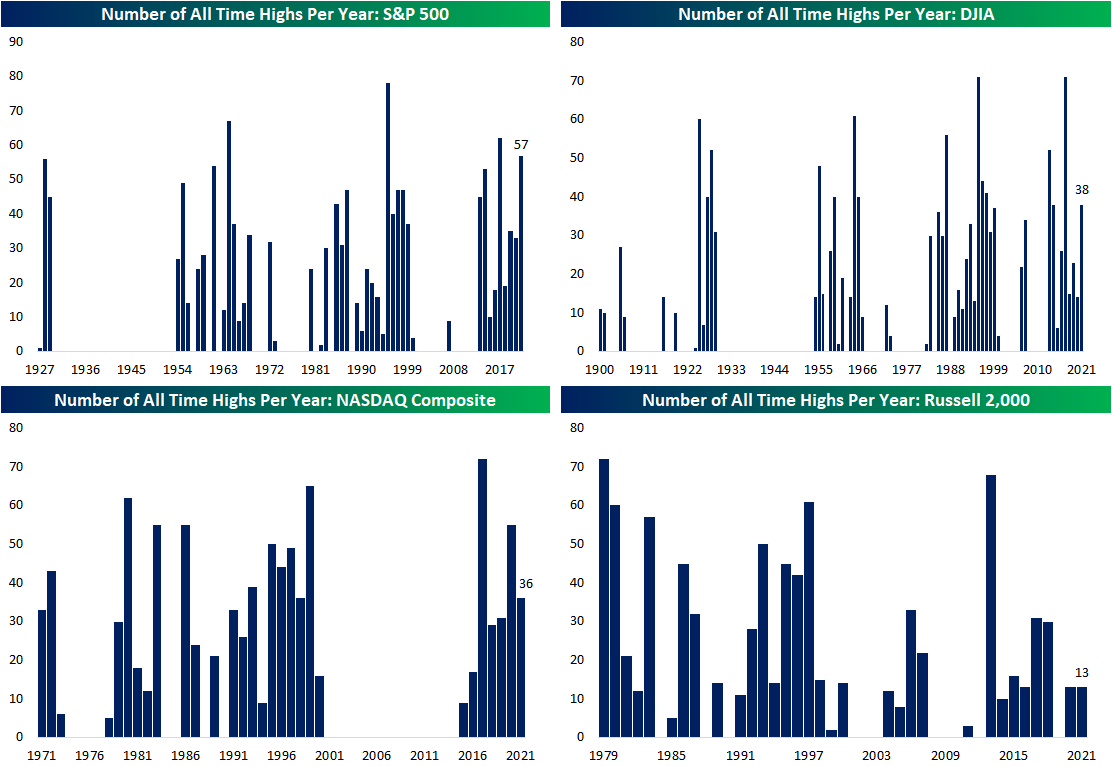
With the S&P 500 having been at new highs over the past few days, it has made 57 new all-time highs year to date. As shown in the top-left chart below, there have only been three other years in the past that have seen more record highs during the full course of the year: 2017 (62), 1964 (67), and 1995 (78). For the other major indices, the pace of record highs is less impressive but still strong. The Dow has made 38 new highs in 2021 which is more than triple the historical average. This year is on pace to see the highest number of record highs for the index since 2017 when it tied 1991 for the record of 71 closes at an all-time high. The Nasdaq Composite has also seen a solid number of highs at 36 which is well above the historical average of 19 per year historically. Given the index has been rangebound essentially all year, the Russell 2,000, conversely, has only seen 13 closing record highs. That is the same number as last year and it is actually below the average of 20 per year historically.
(Click on image to enlarge)
Disclaimer: For more global markets and macroeconomic coverage, make sure to check out Bespoke’s Morning Lineup and nightly Closer notes, as well as our ...
more

