
Here's Why Roblox Stock May Be Headed To $50
Photo: Courtesy Roblox
Roblox Corp RBLX was trading more than 6% lower at one point on Tuesday in consolidation, after a massive 66% increase between May 11 and Monday brought the stock up to the $36.43 mark.
The surge higher negated a long-term downtrend Roblox had been trading in and the retracement lower on Tuesday may become confirmation the stock is about to trade in an uptrend. The retracement, as well as functioning as a possible higher low, may also form a bull flag on Roblox’s daily chart.
The bull flag pattern is created with a sharp rise higher forming the pole, which is then followed by a consolidation pattern that brings the stock lower between a channel with parallel lines or into a tightening triangle pattern.
- For bearish traders, the "trend is your friend" (until it's not) and the stock may continue downwards within the following channel for a short period of time. Aggressive traders may decide to short the stock at the upper trendline and exit the trade at the lower trendline.
- Bullish traders will want to watch for a break up from the upper descending trendline of the flag formation, on high volume, for an entry. When a stock breaks up from a bull flag pattern, the measured move higher is equal to the length of the pole and should be added to the lowest price within the flag.
- A bull flag is negated when a stock closes a trading day below the lower trendline of the flag pattern or if the flag falls more than 50% down the length of the pole.
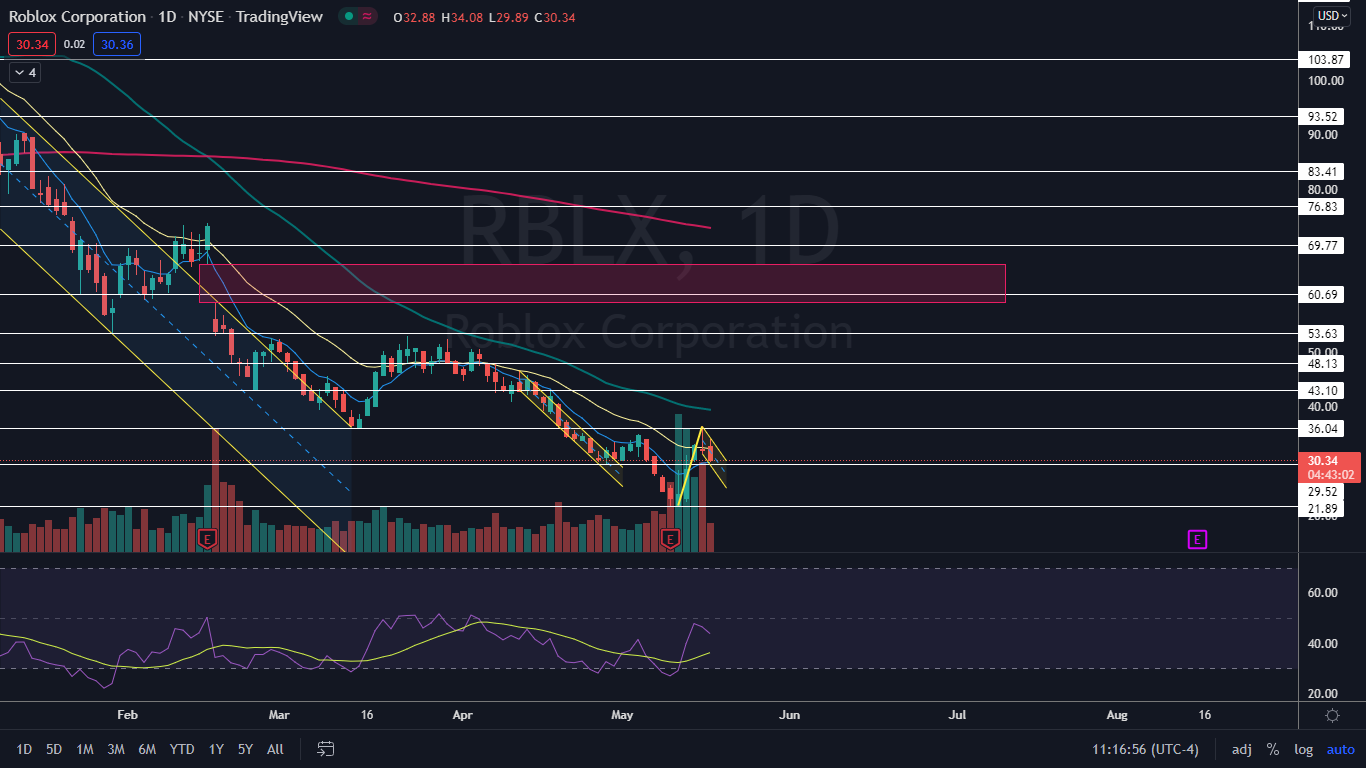
The Roblox Chart: Roblox reversed course on May 11 after printing a bullish double bottom pattern at the $21.98 level on that day and the day prior. The stock then negated its downtrend by printing a higher high above the most recent lower high, which was formed on May 4 and $35.06.
- On Tuesday, Roblox retraced to the eight-day exponential moving average (EMA) but was holding above the level, which is a good sign for the bulls. If Roblox breaks up from the bull flag on higher-than-average volume to confirm the pattern was recognized, the stock will regain support at the 21-day EMA, which would give bullish traders further confidence.
- The measured move on a break up from the flag formation indicates Roblox could trade up toward the $50 mark, although the stock’s unlikely to reach the target without forming a number of higher lows on the way, which could give bullish traders solid entry points.
- Roblox has a gap above between $59 and $66.34. Gaps on charts fill about 90% of the time, which makes it likely the stock will trade up to fill the empty range at some point in the future.
- Roblox has resistance above at $36.04 and $43.10 and support below at $29.52 and $21.89.
(Click on image to enlarge)
© 2022 Benzinga.com. Benzinga does not provide investment advice. All rights reserved.


