
Here's How To Trade Roblox As It Confirms This New Trend

Photo by Yiorgos Ntrahas on Unsplash
Roblox Corporation (RBLX) was trading down about 2% lower on Wednesday in continued consolidation after a 46% move to the upside brought the stock from its March 14 and March 15 all-time low of $36.04 to a high of $53 on March 23.
The consolidation has not negated the new uptrend which Roblox recently confirmed by printing a series of higher highs and higher lows on the daily chart.
The higher highs indicate the bulls are in control, while the intermittent higher lows indicate consolidation periods. Traders can use moving averages to help identify an uptrend with rising lower timeframe moving averages (such as the eight-day or 21-day exponential moving averages) indicating the stock is in a steep shorter-term uptrend and rising longer-term moving averages (such as the 200-day simple moving average) indicating a long-term uptrend.
A stock often signals when the higher high is in by printing a reversal candlestick such as a doji, bearish engulfing or hanging man candlestick. Likewise, the higher low could be signaled when a doji, morning star or hammer candlestick is printed. Moreover, the higher highs and higher lows often take place at resistance and support levels.
In an uptrend the "trend is your friend" until it’s not and in an uptrend there are ways for both bullish and bearish traders to participate in the stock
- Bullish traders who are already holding a position in a stock can feel confident the uptrend will continue unless the stock makes a lower low. Traders looking to take a position in a stock trading in an uptrend can usually find the safest entry on the higher low.
- Bearish traders can enter the trade on the higher high and exit on the pullback. These traders can also enter when the uptrend breaks and the stock makes a lower low, indicating a reversal into a downtrend may be in the cards.
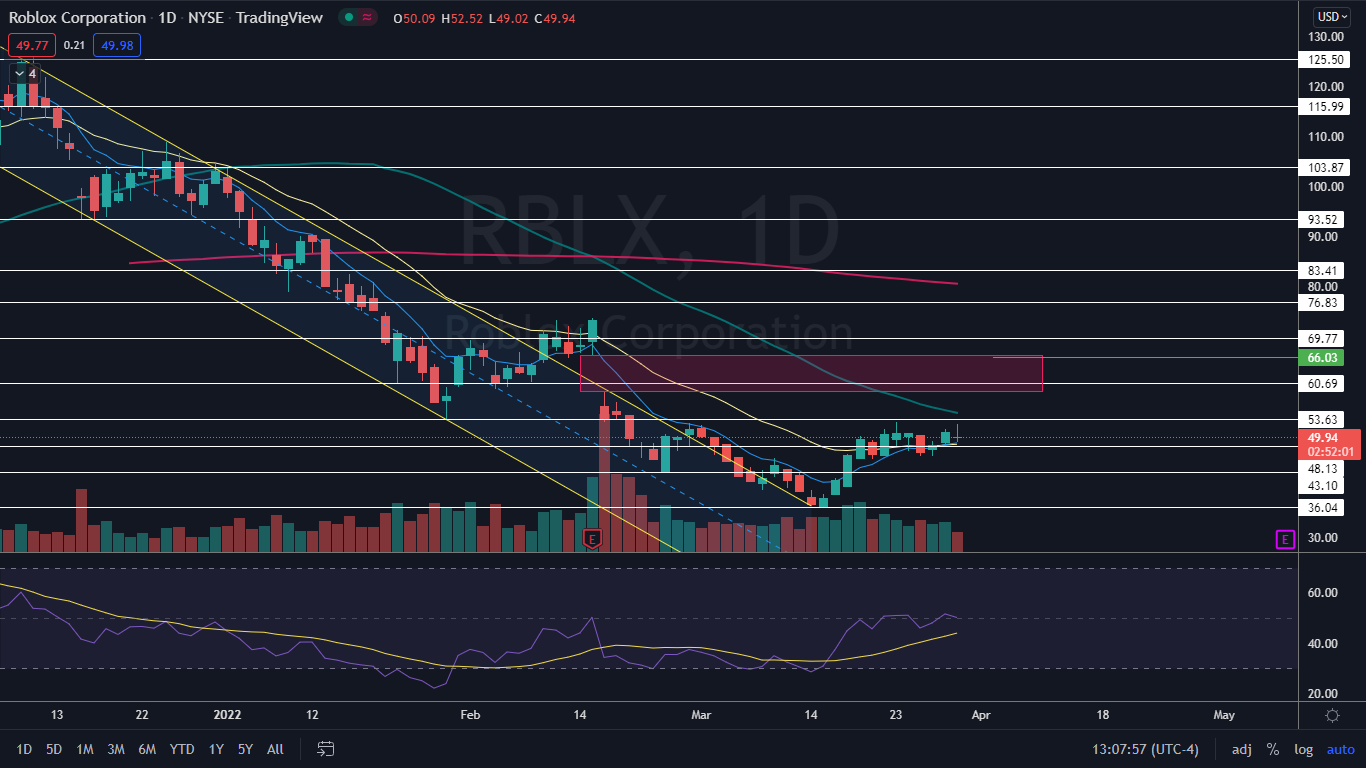
The Roblox Chart
Roblox began trading in an uptrend on March 15 after printing a bullish double bottom pattern on that day and the day prior near the $36 all-time low. The stock’s most recent higher low was created on Monday at the $46.12 and as long as Roblox remains above the level the uptrend will remain intact, although bullish traders will want to see the stock make its next higher high by the end of the trading session on Thursday.
- On Wednesday, Roblox was trading on lower-than-average volume, which indicates a period of consolidation. By early afternoon, only about 13 million Roblox shares had exchanged hands compared to the 10-day average of 23.35 million.
- Roblox has a gap above on the chart between $59 and $66.34. Gaps on charts fill about 90% of the time, so it’s likely the stock will trade up to fill the empty range in the future.
- There’s a possibility Roblox could be developing a bull flag pattern on the weekly chart and if the pattern is recognized the measured move is about 47%, which indicates Roblox could reach the $68 dollar level, which would cause the stock to fill the upper gap.
- If Roblox is able to print a higher high on Thursday, it will cause the stock to regain support at the 50-day simple moving average, which would indicate longer-term sentiment has turned bullish.
- Roblox has resistance above at $53.63 and $60.69 and support below at $48.13 and $43.10.
(Click on image to enlarge)
© 2022 Benzinga.com. Benzinga does not provide investment advice. All rights reserved.


