
Here's Hoping Santa Makes The Trip
It was a very busy weekend in St. Louis, visiting our grandson, daughter and son-in-law, so I'm going to keep the subjective side of this report short and let the models and indicators do most of the talking. But first, let me say that watching a two-year old tear into presents is about as much fun as a grandparent can have!
In the spirit of the season, the WSJ has an article about the traditional Santa Claus Rally this morning. To review, the Santa rally spans the last five trading days of the year and the first two trading days of the new calendar year. While we are still a few sessions away from the official starting date, the article points out that the average gain for the seven-day span has been 1.3% for the S&P 500 and that the last time Santa failed to appear at the corner of Broad and Wall was 2015. The problem is the S&P 500 index is currently down 2.8% (however, the "total return" index - which reinvests dividends is currently up 1%). As such, if the bulls hope to push the venerable index back into the black for the year, they've got some work to do.
Our heroes in horns remind us that there are two possible developments that could get the year-end party started this week. First, there is the Fed meeting, which concludes with a Jay Powell presser on Wednesday. The bulls hope that the Fed Chair's comments will be in the spirit of the holidays and take a dovish tilt - as in, a rate hike and then a pause to reflect on the changing economic climate.
The second potential bullish trigger is more of a stretch as a potential government shutdown is slated for 12:01 a.m. Saturday. Both sides are dug in and hopes for a deal are not high as we enter the week. But lest we forget, a week in Washington D.C. is like a year everywhere else. Fingers crossed that a deal gets done.
Looking at the action in the stock market, there is only one word that can be applied to last week: U-G-L-Y. The problem is that all the news is bad, including the most recent economic data on China. (And did we really need an old story about asbestos in baby powder at this time?)
With prices acting the way they are, it would appear that a test of the February lows is now required. And how the market reacts during such a test will hold the key to the near-term trend. If the bulls can make a stand, it follows that Santa could make an appearance. But if the lows break for more than a day or two, all traders and their computers are going to be emboldened to sell.
It is also worth noting that the so-called "wash out" has yet to occur. Traders are looking for a spike above 28 on the VIX, a big increase in volume, extreme readings in sentiment, and then a reversal day. Stay tuned because it doesn't look like we are there yet on any of the above.
I'll leave you with one last thought. An age-old Wall Street saw, which says, "If Santa fails to call, the bears may come to Broad and Wall." According to the Stock Trader's Almanac, if Santa doesn't deliver, it doesn't bode well for stocks in the new year. The last six times the rally didn't happen were followed by three flat years in 1994, 2004, and 2015, two bear markets in 2000 and 2008, and then a downturn that ended in February 2016.
So here's hoping that Mr. Powell & Co. can help Santa make the trek this year.
Now let's turn to the weekly review of my favorite indicators and market models...
The State of the Big-Picture Market Models
I like to start each week with a review of the state of my favorite big-picture market models, which are designed to help me determine which team is in control of the primary trend.
View My Favorite Market Models Online
The Bottom Line:
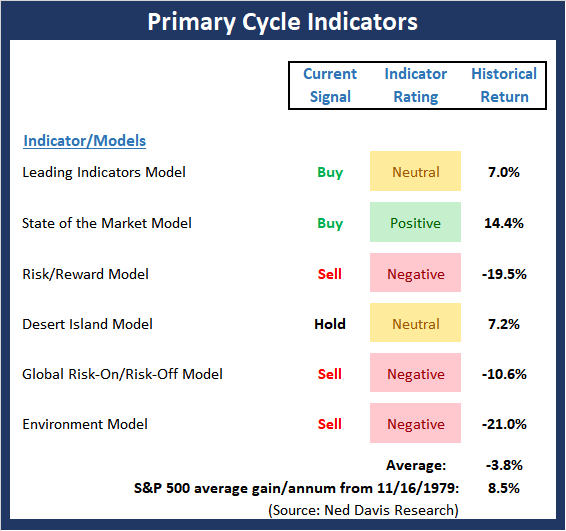
- There were two important changes to the Primary Cycle board this week. First, my "Desert Island" model, which has been flip-flopping of late, slipped back into the neutral zone. Second, the "Environment" model moved to negative and issued a sell signal.
The takeaway from the board this week is things have deteriorated, which increases the odds that a cyclical bear market has taken hold. Note that the historical average return for the S&P 500 given the current board readings is now -3.8%
Note: We recently added a new model to the Primary Cycle board. Since most big moves in the market tend to be global in scope, we've added a "Global Risk-on/Risk-off" model based on global markets. Unfortunately, this indicator remains negative at this time.
This week's mean percentage score of my 6 favorite models declined to 47.8 (from 53.6%, 2 weeks ago: 57.9%, 3 weeks ago: 64.5%) while the median fell to 45% (from 55%, 2 weeks ago: 52.5%, 3 weeks ago: 65%).
The State of the Trend
Once I've reviewed the big picture, I then turn to the "state of the trend." These indicators are designed to give us a feel for the overall health of the current short- and intermediate-term trend models.

View Trend Indicator Board Online
The Bottom Line:
- The Trend board continues to be overwhelmingly negative. This is an indication that a confirmed downtrend is in place. Should the S&P 500 break and hold below the February lows for more than a couple days, the odds that the current corrective phase will morph into a cyclical bear would increase dramatically.
The State of Internal Momentum
Next up are the momentum indicators, which are designed to tell us whether there is any "oomph" behind the current trend.
View Momentum Indicator Board Online
The Bottom Line:
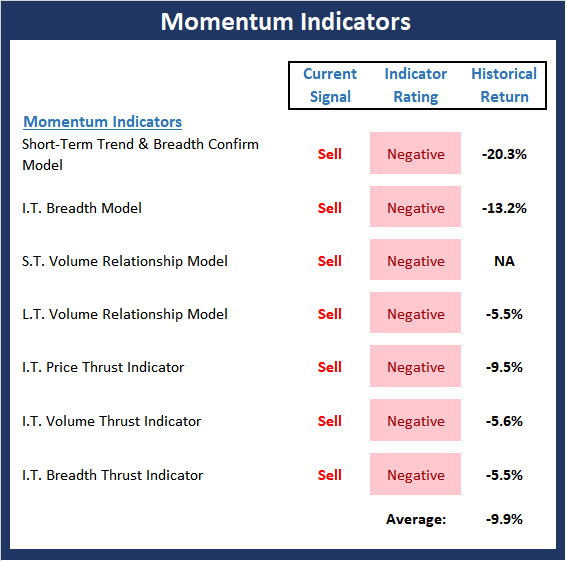
- In case the deterioration seen in the Primary Cycle board and the extreme negative readings in the Price Trend board don't make the situation obvious, the unanimous negative readings seen in the Momentum board should cement the fact that conditions are extremely weak. The good news is that this type of condition tends to lead to countertrend rallies. The bad news is the severity of the damage done usually takes time to recover and suggests that the lows will need to be tested and retested before a true rebound can take hold.
The State of the "Trade"
We also focus each week on the "early warning" board, which is designed to indicate when traders might start to "go the other way" -- for a trade.
View Early Warning Indicator Board Online
The Bottom Line:
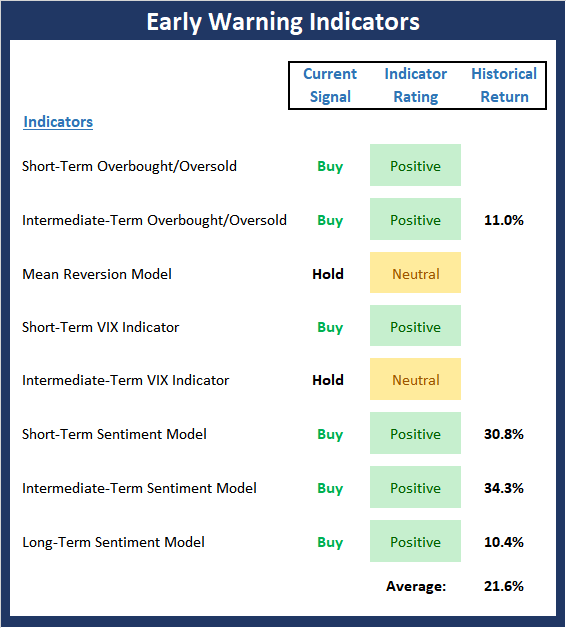
- From a shorter-term perspective, the "Early Warning" board is now sending a clear signal that a countertrend rally could begin at any time. However, longer-term, the VIX and sentiment readings are NOT high enough to provide a "washed out" reading.
The State of the Macro Picture
Now let's move on to the market's "environmental factors" - the indicators designed to tell us the state of the big-picture market drivers including monetary conditions, the economy, inflation, and valuations.

View Environment Indicator Board Online
The Bottom Line:
- There is an important improvement in External Factors board this week. While the Monetary and Valuation factors continue to be a problem, the Inflation Composite has improved to positive, joining the economic and earnings components in the green zone.
Disclosure: At the time of publication, Mr. Moenning held long positions in the following securities mentioned: none - Note that positions may change at any time.
The opinions and forecasts ...
more

