
Here We Go Again?
For those of you keeping score at home, the S&P 500 is in the midst of the second-longest stretch without a 3% correction in the last 10 years (source: Ned Davis Research Group). Although the action was certainly exciting at times last week, that streak remains intact as the S&P closed Thursday down just 2.55% from the recent high and rose 0.4% on Friday. And based on the action in the early going, it appears that the bears will make another attempt to push lower again this morning.
Granted, it took some impressive "dip buying" to keep the market out of the -3% correction zone last week as both Thursday and Friday saw pretty big intraday reversals. But the bottom line is the current pullback can so far be categorized as garden variety.
Yet the recent volatility does not allow pundits to sow seeds of fear by pronouncing that the next big, bad, decline is just around the corner. And with the memories of the market's Q4 frightening market hysterics still fresh, investors can't be blamed for worrying that something ugly is about to happen again.
Pullbacks vs. Bears
At this stage of the game, it is important to recognize that trade news alone isn't likely to cause the type of devastation that tends to occur in bear markets. And so far at least, the action doesn't even resemble the near-bear seen at the end of last year. Hedge funds aren't blowing up and causing forced selling. The Fed isn't on the warpath. The economy isn't in bad shape. Inflation isn't a problem. And valuations aren't extraordinary relative to the last twenty years.
To borrow an argument made by Leon Cooperman on Friday, the conditions for an important top in the stock market just aren't present at the current time. So, unless things change, investors should probably view the current sloppy action as a normal pullback and act accordingly.
Remember, history (and the database at Ned Davis Research Group) reminds us that corrections are normal. In fact, the S&P 500 has, on average, experienced corrections of at least 5% more than three times a year and has seen at least one decline of 10% or more in any given year. Thus, the current pullback of -2.5% on a closing basis and -4.35% on an intraday basis doesn't appear to be anything out of the ordinary. Well, at least at this stage.
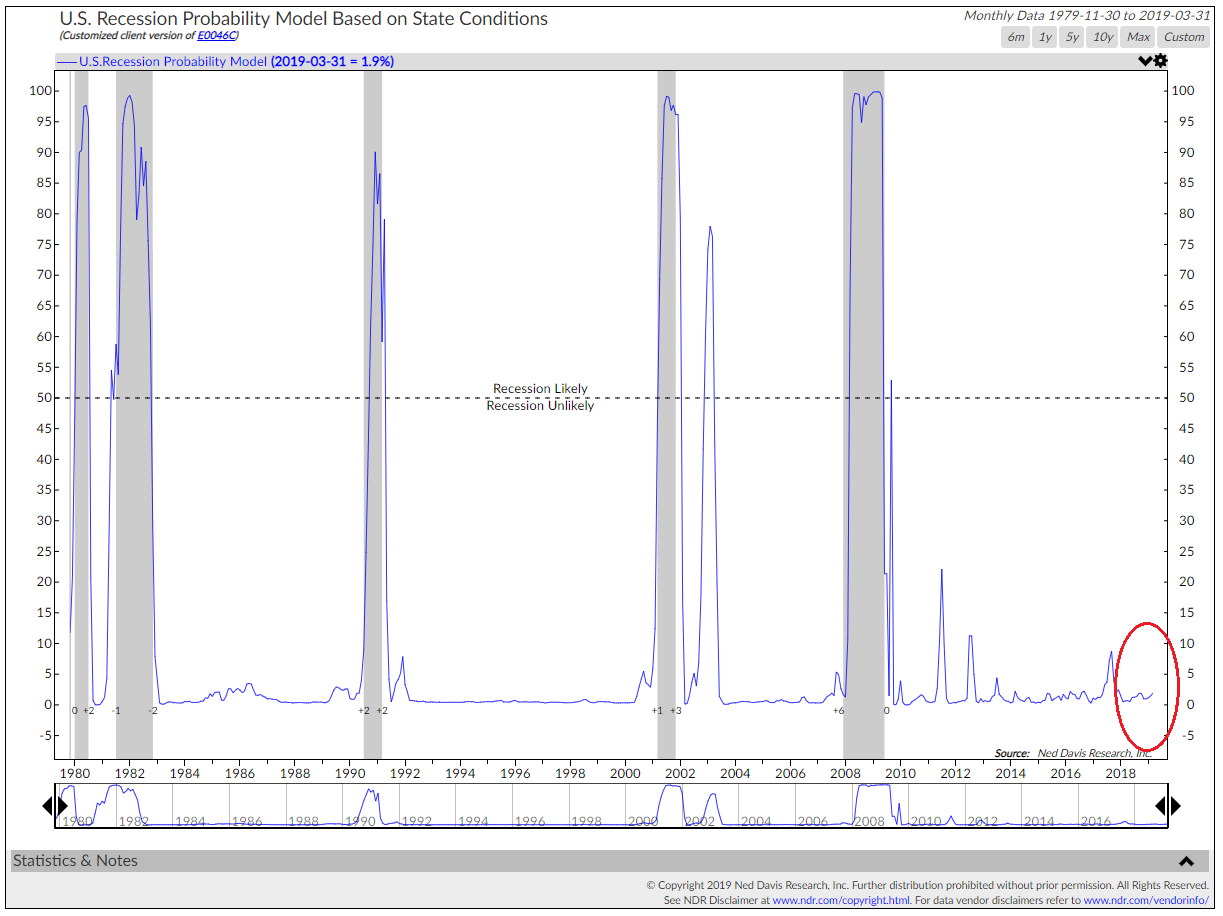
The question, of course, is if the decline will worsen. As you are likely aware, history shows that the biggest and worst stock market declines tend to be accompanied by a recession in the U.S. And since there has been a lot of talk about the state of the economy since last fall, I thought it might be time to check in on NDR's U.S. Recession Probability Model.
This model uses a regression of state coincident indexes from the Federal Reserve Bank of Philadelphia. The state indices combine nonfarm employment, average manufacturing hours worked, the unemployment rate, and real wages/salaries. The idea is to look at the "health" of the state economies in order to get a feel for the state of the overall economy.
As the chart below shows, the odds of a recession in the near term remain very low - at least as far as the health of state economies are concerned.
(Click on image to enlarge)
Another way to look at the probability of recession is through the lens of the yield curve. The thinking here is that when yields on longer-term bonds (typically the U.S. 10-Year) fall below short-term yields (typically the 2-year), it means the bond market is worried about economic growth.
There has been MUCH discussion on this topic lately as the yield curve has long been viewed as a strong predictor of recessions. The key is that some versions of the yield curve have briefly inverted - yet others have not. But as the chart below shows, there can be no arguing that the risks associated with the flattening yield curve are on the rise.
(Click on image to enlarge)

However, it is also important to take note of the red arrows on the chart. The bottom line is that a flattening or inverted yield curve does not always mean a recession is likely in the near future.
Back to Trade
To be sure, headlines on the state of trade negotiations with China have driven stock prices of late and will again today as there is word that the Chinese are talking about dumping U.S. Treasury Bonds. And I think everybody will agree than a protracted trade war would be negative for all parties involved as well as the global economy. Yet, with negotiations ongoing, the market appears to be thinking that a deal will get done at some point.
Another thought is to calculate how the current tariffs would impact our economy if left in place for an extended period of time. According to Mr. Cooperman, this could knock 0.5% off GDP, add to inflation measures, and cut $5 from S&P 500 earnings. And according to Cooperman's back-of-the-napkin analysis, $5 times a 17 multiple equals 85 S&P points, which is about the size of the decline we've seen so far.
My Models Suggest...
While it is fun to prognosticate what is likely to occur on the economic/earnings/inflation/yield fronts, I'm not a fan of making predictions about what is going to happen next in Ms. Market's game. No, I prefer to try and stay in tune with what IS happening now.
It is for this reason that I rely on a myriad of indicators/models to suggest what is actually going on in the market. So, my final point on this fine Monday morning is that in order to get a feel for the big-picture market backdrop, it is a good idea to review the fundamentals. And it is precisely for this reason that we built our Fundamental Indicators scoreboard.
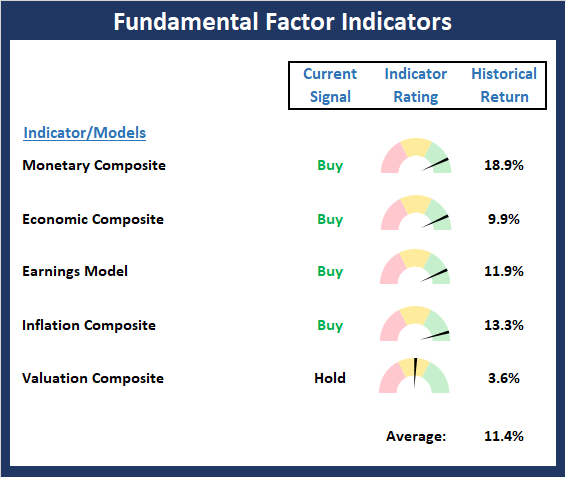
As you can see from the board, the "fundies" are in pretty good shape. Monetary conditions remain positive. The Economic composite suggests the economy is doing just fine. Earnings remain strong. Inflation is low. And Valuations are relatively neutral. So, as Mr. Cooperman pointed out last week, conditions are not set for a significant top in the stock market.
However, this does NOT mean that a "bad news panic" can't occur/continue due to trade. No, the point is that the risk of a recession appears to be low and as such, any corrective action in the stock market is likely to be temporary.
Weekly Market Model Review
Now let's turn to the weekly review of my favorite indicators and market models...
The State of My Favorite Big-Picture Market Models
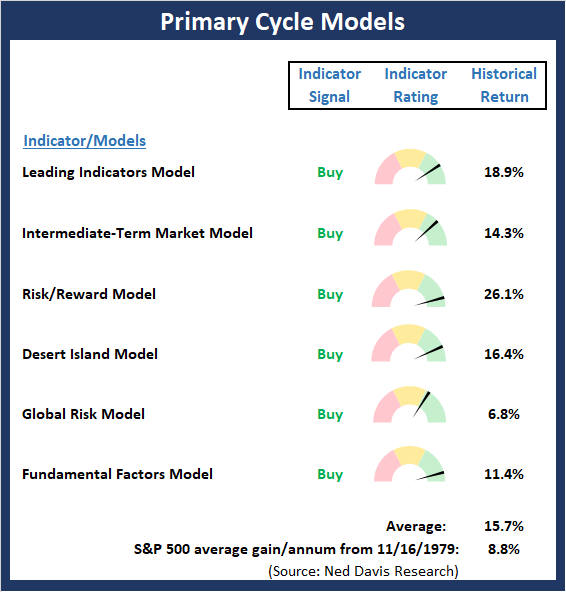
Despite the recent pullback in stock prices, the Primary Cycle board remains in good shape. I will note however that the Global Risk Model has pulled back a bit recently and is now positive by the slimmest of margins. But the bottom line is with the board still positive overall, investors may want to use the current dip to put money to work.
This week's mean percentage score of my 6 favorite models pulled back for a second straight week to 81.1% from 83.9% last week (Prior readings: 84.7%, 74.6%, 58.0%, 49.5%, 47%, 50%) while the median slipped to 82.5% from 86.7% last week (Prior readings: 86.7%, 81.8%, 65.9%, 50%, 50%, 50%, 50%).
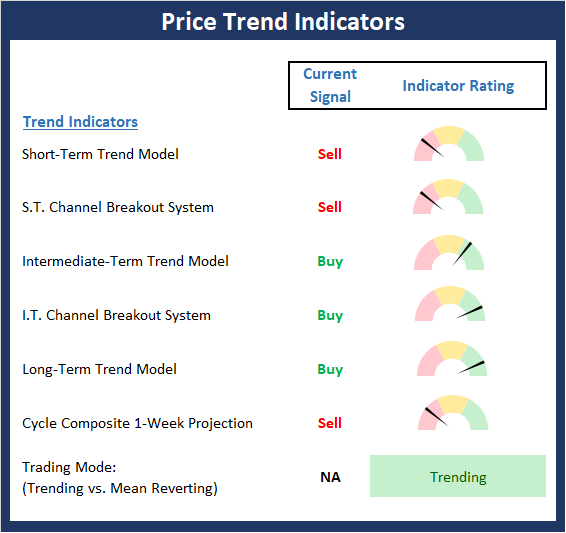
The State of the Trend
The long-awaited pullback continued last week as traders and their computers moved to a risk-off position in response to news relating to trade. However, by the end of the week, hope for a deal increased and a modest rebound ensued. The fact that stocks have pulled back should come as no surprise to anyone paying attention as the market had become overbought and sentiment was overly positive. As a reminder, the market historically has experienced an average of 3 pullbacks of 5% or more per year. And given that the current run without a 3% decline was the second longest since the bull began in 2009, the bears were due.
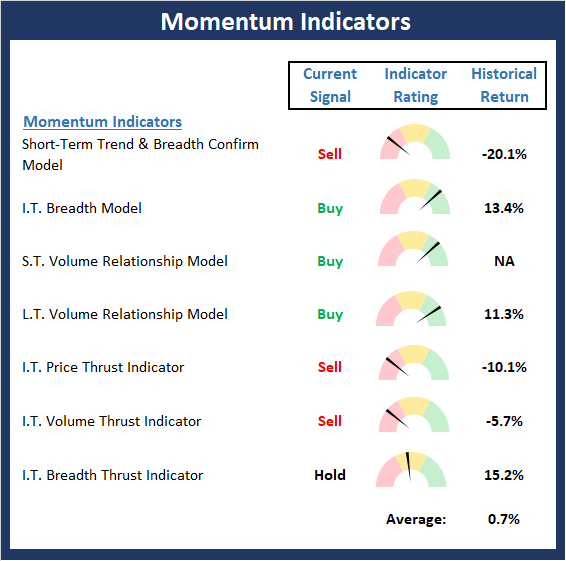
The State of Internal Momentum
Not surprisingly, the Momentum Board has weakened a bit over the last couple weeks as three shorter-term sell signals have occurred in the areas of price and price/volume thrusts. However, from a big picture standpoint, the models are still in decent shape and supportive of the bulls.
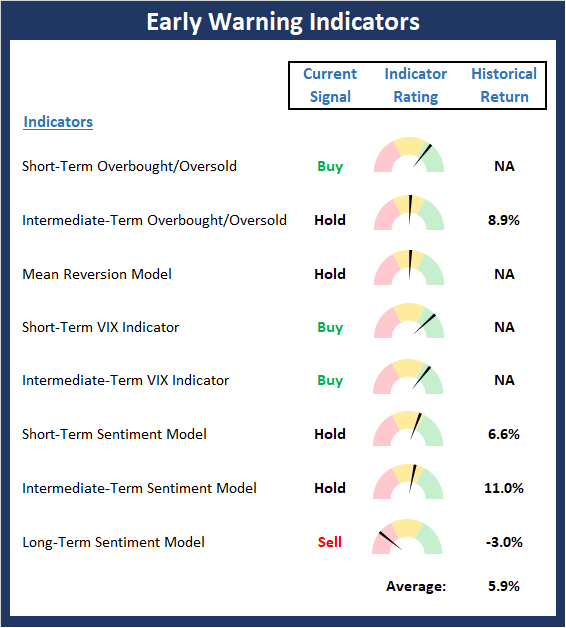
The State of the "Trade"
The message from the Early Warning board has shifted gears. Recall that the board did a nice job of warning that conditions were ripe for some form of a pullback. Now the board suggests that the winds are shifting, and the indicators are starting to favor the bulls. To be sure, this is not a "pound the table" situation. But the improvement in the indicators suggest that investors can begin looking for entry points.
The State of the Fundamental Backdrop
There were no real changes to the Fundamentals board this week as the backdrop continues to support an ongoing bull market. So, as Leon Cooperman suggested last week, conditions are not present for a major decline at this time.
Disclosure: At the time of publication, Mr. Moenning held long positions in the following securities mentioned: none - Note that positions may change at any time.
The opinions and forecasts ...
more

