
Has The Bounce Peaked?
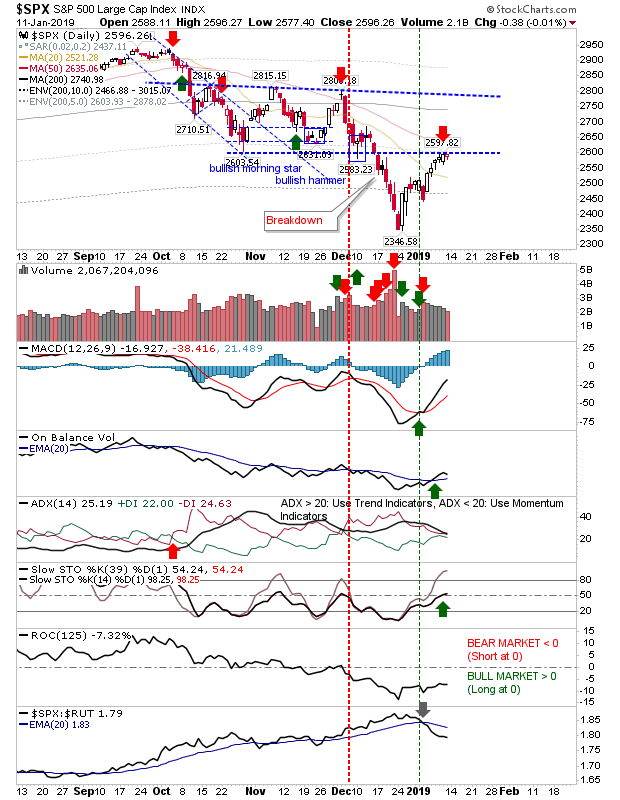
Friday offered a day of tight trading on low volume. Swing traders can take advantage of this by trading a break of Friday's range (buy break of high/short loss of low) and setting a stop on the flip side of Thursday's range (of Friday's if you want to take on less risk). This set-up looks the most logical for the S&P.
The S&P again kept to resistance defined by the October spike low and now has the 50-day MA offering some additional resistance. Technicals have edged bullish except the Directional indicator which has been slowing since November; an indication of a possible switch to a trading range. Going forward, I would be looking for a shallow decline, perhaps to the 2,500's, before prices stabilize as a sideways range. Again, look to this swing trade because if Monday starts brightly and can maintain that strength after the opening half hour it will stress existing shorts into covering their positions and open up for a move to the 200-day MA.
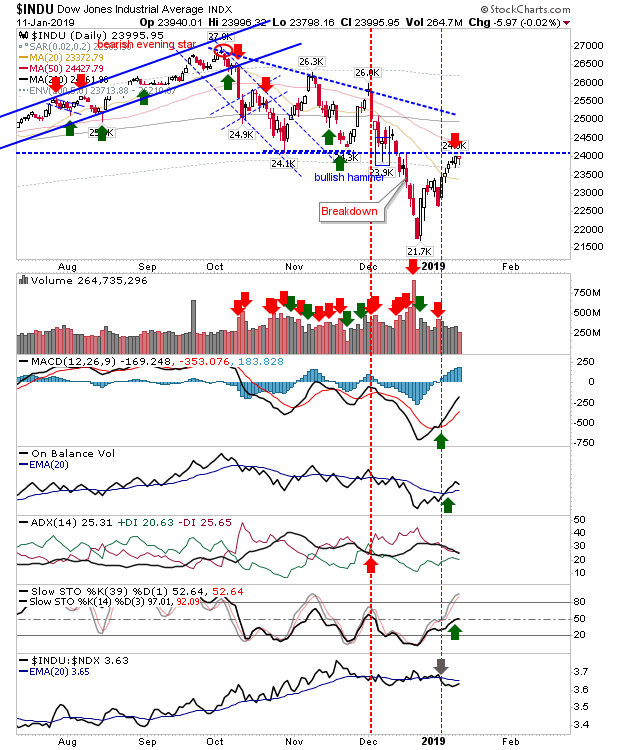
What goes for the S&P applies to the Dow too.
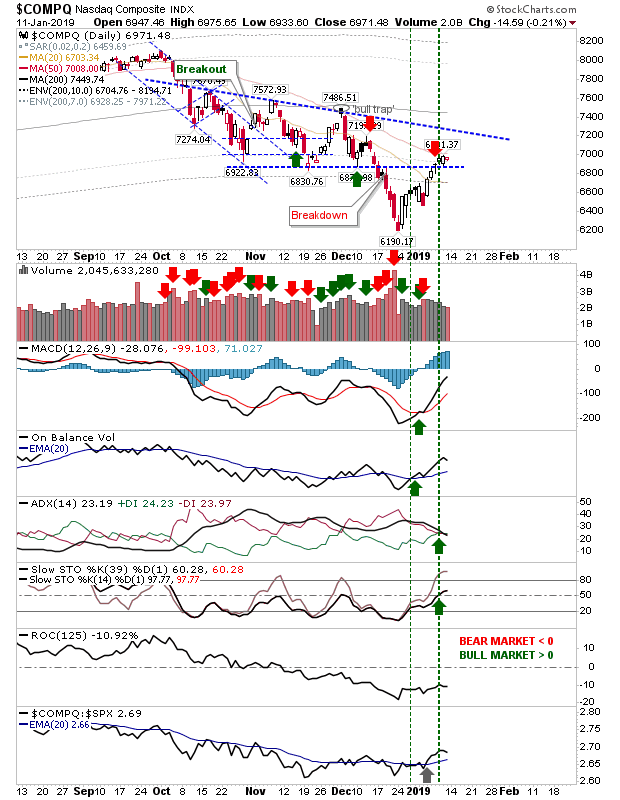
If you are perhaps of a more bullish bent, then the Nasdaq may be the better play. It finished the week above the corresponding October swing low resistance which is troubling the S&P. It does still have the 50-day MA to navigate but if it can break this then there is a chance to move to resistance marked by the blue hashed lines (connecting the three swing highs from October through December). Technicals are net bullish and improving, including a nice uptick in relative performance against the S&P.
The Nasdaq 100 is perhaps a little more bullish than the Nasdaq but the same principles apply.

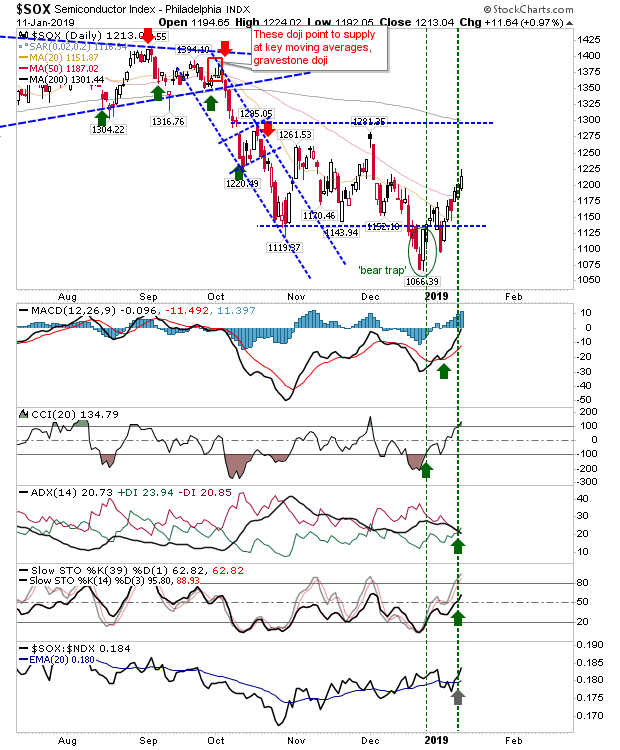
And fueling the Tech recovery is a strengthening bounce in the Semiconductor Index. I would like to see a trading range established here but let's see how far this bounce goes. Note, it did not end the week on a narrow doji so buyers still have control.
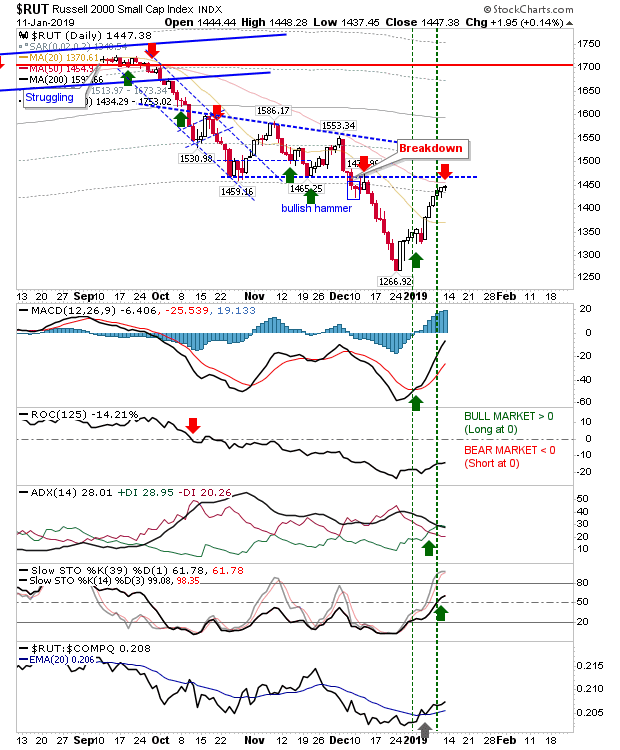
The Russell 2000 is perhaps the most interesting. I thought it would have the legs to make it back to October resistance around 1,460 (as the S&P and Nasdaq had done) but it now finds itself stalling out at 1,447. It now has the 50-day MA to deal with too as this moving average trades below the aforementioned October resistance. Technicals are net bullish and the index still outperforms the Nasdaq and S&P but if you had bought the recent bounce as a trade rather than a long term investment then taking profits looks prudent. Shorts could enjoy a nice run here if it breaks because Small Caps look the most vulnerable to further losses.
For tomorrow, shorts can look to the Russell 2000, S&P and Dow, longs have the Nasdaq and Nasdaq 100 to lean on; all trades - from either aspect - can be played as a swing trade.


