
Happy Holidays For Investors? Watch The Market’s Vital Signs
In our previous Nov 7th Stock Market Update, we said that the choppy price activity during September and October was likely to become the springboard for the US stock market’s next trending phase.
Chart 1 below, an updated version of the one from that report, shows that this next trending phase is apparently higher as the benchmark S&P 500 (SPX) spiked upward from its two-month sideways investor indecision area on Nov 9th, as Pfizer said its COVID vaccine was more than 90% effective.
(Click on image to enlarge)
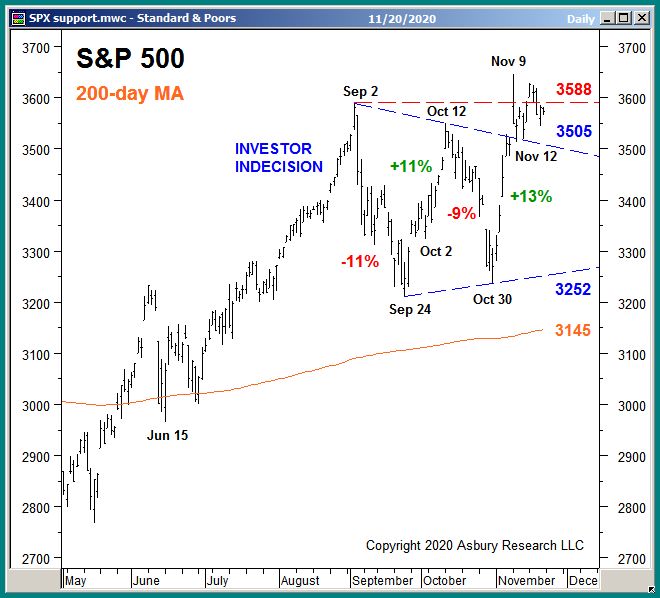
Chart 1
Despite the lack of upward follow-through thus far, as long as the index manages to remain above the 3505 upper boundary of its September-October indecision area, the bullish implications of its Nov 9th breakout— which target an upcoming rise to 3850 — will remain intact.
Meanwhile, our Asbury 6 risk management model supports the recent breakout higher — and actually preceded the breakout by almost a week as it turned back to Positive (bullish) on Nov 4th.
The purpose of the “A6” is to be a standard check of the US stock market’s baseline health, much like the initial part of your trip to the doctor’s office always includes the same routine: the doctor takes your temperature, checks your blood pressure, listens to your heart, checks your reflexes, and may take some blood.In the same way, the Asbury 6 checks price momentum, the relative performance of stocks versus bonds, investor asset flows, the bond market’s assessment of risk, trading volume, and market breadth. Both are repeatable routines that establish the baseline health of the “patient”, so we know what to do going forward.
(Click on image to enlarge)
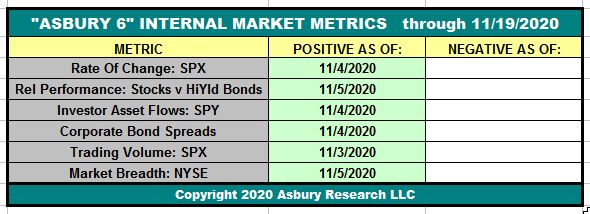
Table 1
The “A6” is updated every day in our Research Center (access requires subscription). Four or more metrics in one direction, either Positive (green) or Negative (red), indicate a tactical bias. The dates in each cell indicate when each individual constituent of the A6 turned either positive (green) or negative (red). When all Asbury 6 are positive, market internals are the most conducive to adding risk to portfolios. Each negative reading adds an additional element of risk to participating in current or new investment ideas.
We will be closely monitoring the S&P 500’s ability to keep its Nov 9th breakout valid — while closely monitoring its internal health — to determine whether or not investors will have a happy holiday season in 2020.
Disclosure: None.


An interesting evaluation here.
One thing is always true is that an examination of the healthy will seldom include much data about those who are very ill.
Looking at the giants will reveal very little about the small folks.