
Goodyear Tyres On Slicks
(Click on image to enlarge)
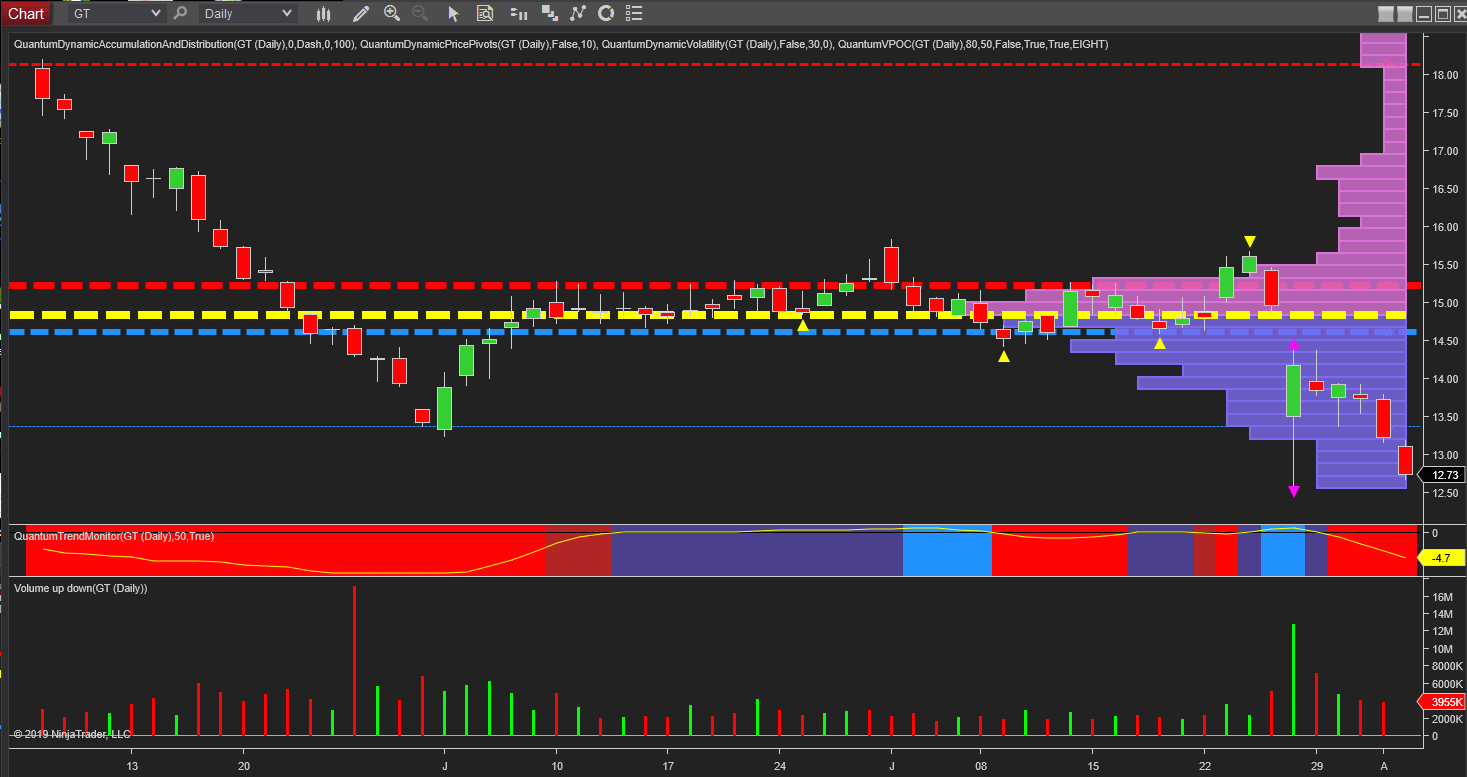
The chart for Goodyear Tyre's (GT) is another where the volatility indicator has been in evidence and is a stock I considered back in May when it was trading at $14.47 per share, with a post entitled Goodyear continues sliding ever lower. Suffice to say over the last couple of weeks, we have seen the stock gap down, before closing last week at $12.73 per share, with more downside momentum to come.
The most significant candle on the daily chart was on the 26th July as the price opened gapped down before rallying to the close. A move that was outside the ATR for GT and consequently triggering the volatility indicator with the price duly reversing and descending lower. This was on weaker than expected earnings of $0.25 against a forecast of $0.31, a big miss, and one weighing heavily on the longer term trend. The trend monitor indicator remains firmly red, and once the price action is clear of the lower leg of the volatility candle at $12.50 per share, GT looks set to fall further, and test single figures in the longer term.
Disclaimer: Futures, stocks, and spot currency trading have large potential rewards, but also large potential risk. You must be aware of the risks and be willing to accept them in order to invest in ...
more

