
Goodyear Tire Retains Position As Top Stock On Our S&P 500 Top-Ten List
The components of have changed little since the last time we presented the top S&P picks in late March Our leader is still Akron's Finest., Goodyear Tire. Assurant retains its second-place spot. Valero, Traveler's, and LAM Research have moved up. Delta Airlines and Hartford Financial have declined. Our three newcomers are Tyson Foods, AT&T, and Southwest Airlines are back in our top-ten list.
|
Ticker |
Company Name |
Market Price |
Valuation |
Last 12-M Retrn |
1-M Forecast Retn |
1-Yr Forecast Retn |
P/E Ratio |
Sector Name |
Last Month Top Ten |
|
GOODYEAR TIRE |
32.3 |
-2.67% |
17.48% |
1.30% |
15.71% |
9.34 |
Auto-Tires-Trucks |
GT |
|
|
ASSURANT INC |
81.41 |
26.40% |
32.91% |
1.19% |
14.27% |
13.35 |
Finance |
DAL |
|
|
VALERO ENERGY |
60.22 |
-8.48% |
4.79% |
1.14% |
13.74% |
7.37 |
Oils-Energy |
AIZ |
|
|
TRAVELERS COS |
115.8 |
5.12% |
9.10% |
1.09% |
13.15% |
10.59 |
Finance |
VLO |
|
|
LAM RESEARCH |
82.67 |
-8.99% |
14.84% |
1.08% |
12.92% |
13.80 |
Computer and Technology |
FSLR |
|
|
TYSON FOODS A |
63.67 |
15.21% |
65.42% |
1.07% |
12.89% |
17.21 |
Consumer Staples |
TRV |
|
|
AT&T INC |
38.72 |
3.01% |
17.94% |
1.05% |
12.64% |
14.08 |
Utilities |
PSX |
|
|
DELTA AIR LINES |
46.6 |
-25.88% |
1.90% |
1.04% |
12.50% |
8.46 |
Transportation |
HIG |
|
|
SOUTHWEST AIR |
47.05 |
-6.48% |
10.52% |
1.04% |
12.43% |
12.68 |
Transportation |
EMN |
|
|
HARTFORD FIN SV |
46.56 |
13.88% |
10.62% |
1.03% |
12.31% |
12.00 |
Finance |
LRCX |
NOTE: New stocks are in BOLD.
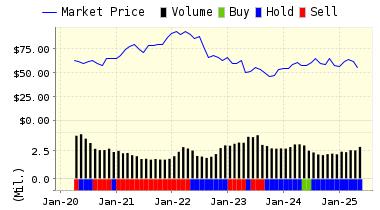
Below is today's data on one of our newcomers, Tyson Foods (TSN):
Tyson Foods, Inc. is the world's largest fully-integrated producer, processor and marketer of chicken and poultry-based food products. Tyson is a comprehensive supplier of value-added chicken products through food service, retail grocery stores, club stores and international distribution channels. Although its core business is chicken, in the United States Tyson is also the second largest maker of corn and flour tortillas under the Mexican Original brand and through its subsidiary Cobb Vantress, the top chicken breeding stock supplier.
Recommendation: ValuEngine continues its BUY recommendation on TYSON FOODS A for 2016-04-20. Based on the information we have gathered and our resulting research, we feel that TYSON FOODS A has the probability to OUTPERFORM average market performance for the next year. The company exhibits ATTRACTIVE Sharpe Ratio and Momentum.
|
ValuEngine Forecast |
||
|
Target |
Expected |
|
|---|---|---|
|
1-Month |
64.35 | 1.07% |
|
3-Month |
65.79 | 3.33% |
|
6-Month |
67.79 | 6.47% |
|
1-Year |
71.88 | 12.89% |
|
2-Year |
76.71 | 20.48% |
|
3-Year |
76.43 | 20.04% |
|
Valuation & Rankings |
|||
|
Valuation |
15.21% overvalued |
Valuation Rank |
|
|
1-M Forecast Return |
1.07% |
1-M Forecast Return Rank |
|
|
12-M Return |
65.42% |
Momentum Rank |
|
|
Sharpe Ratio |
1.04 |
Sharpe Ratio Rank |
|
|
5-Y Avg Annual Return |
24.90% |
5-Y Avg Annual Rtn Rank |
|
|
Volatility |
23.85% |
Volatility Rank |
|
|
Expected EPS Growth |
7.84% |
EPS Growth Rank |
|
|
Market Cap (billions) |
23.85 |
Size Rank |
|
|
Trailing P/E Ratio |
17.21 |
Trailing P/E Rank |
|
|
Forward P/E Ratio |
15.96 |
Forward P/E Ratio Rank |
|
|
PEG Ratio |
2.20 |
PEG Ratio Rank |
|
|
Price/Sales |
0.60 |
Price/Sales Rank |
|
|
Market/Book |
2.44 |
Market/Book Rank |
|
|
Beta |
0.30 |
Beta Rank |
|
|
Alpha |
0.56 |
Alpha Rank |
|
Market Overview
|
Summary of VE Stock Universe |
|
|
Stocks Undervalued |
52.8% |
|
Stocks Overvalued |
47.2% |
|
Stocks Undervalued by 20% |
22.26% |
|
Stocks Overvalued by 20% |
15.42% |
Sector Overview
|
Sector |
Change |
MTD |
YTD |
Valuation |
Last 12-MReturn |
P/E Ratio |
|
Basic Materials |
0.13% |
11.00% |
32.27% |
20.63% overvalued |
7.22% |
28.68 |
|
Consumer Staples |
-0.56% |
0.85% |
5.34% |
10.28% overvalued |
-2.55% |
24.09 |
|
Utilities |
-1.08% |
0.30% |
7.26% |
7.52% overvalued |
-3.21% |
23.18 |
|
Multi-Sector Conglomerates |
0.49% |
2.37% |
7.25% |
7.33% overvalued |
-6.85% |
17.63 |
|
Industrial Products |
0.56% |
4.64% |
8.69% |
6.52% overvalued |
-11.25% |
20.00 |
|
Oils-Energy |
1.18% |
9.29% |
11.97% |
4.56% overvalued |
-36.16% |
23.12 |
|
Business Services |
0.12% |
1.72% |
7.72% |
4.32% overvalued |
-9.06% |
22.61 |
|
Construction |
0.01% |
3.77% |
18.60% |
0.23% undervalued |
-4.92% |
21.11 |
|
Aerospace |
-0.03% |
2.49% |
-0.85% |
0.35% undervalued |
-6.59% |
20.45 |
|
Finance |
0.38% |
2.90% |
1.17% |
1.30% undervalued |
-5.85% |
16.06 |
|
Computer and Technology |
0.21% |
0.69% |
6.08% |
2.11% undervalued |
-8.76% |
27.32 |
|
Consumer Discretionary |
0.04% |
1.42% |
3.38% |
3.92% undervalued |
-9.99% |
23.53 |
|
Retail-Wholesale |
0.64% |
1.29% |
1.69% |
5.04% undervalued |
-13.54% |
22.64 |
|
Auto-Tires-Trucks |
0.46% |
2.10% |
3.82% |
6.36% undervalued |
-14.70% |
12.49 |
|
Transportation |
0.30% |
5.24% |
6.27% |
7.13% undervalued |
-26.47% |
13.76 |
|
Medical |
0.77% |
6.05% |
-2.00% |
8.39% undervalued |
-20.57% |
26.44 |
Valuation Watch: Overvalued stocks now make up 47.2% of our stocks assigned a valuation and 15.42% of those equities are calculated to be overvalued by 20% or more. Seven sectors are calculated to be overvalued.
Disclosure: None.
Disclaimer: ValuEngine.com is an independent research provider, producing buy/hold/sell recommendations, ...
more

