
Give Your Portfolio Some Insurance With This Industry Leader
We suggest investors look past the current economic downturn and set their sights on the opportunity that awaits when the economy recovers. Those overlooking Allstate Corp (ALL: $95/share) are in the Danger Zone. Those willing to see through the dip should consider adding this Long Idea to their portfolios.
Another Baby Thrown Out with the Bathwater
We first made Allstate a Long Idea in June 2015 and closed the position in August 2015 after the stock was downgraded to a Neutral rating. Since then, Allstate’s fundamentals have significantly improved and the stock currently earns a Very Attractive rating, along with a spot in May’s Most Attractive Stocks Model Portfolio.
Before COVID-19, Allstate was leveraging data and technology to run a more efficient and profitable business. While the industry will certainly face challenges in the short term, we expect the demand for insurance, whether home, auto, life, or even protection plans, will rebound when the economy recovers.
Strong Profit Growth Over the Past Decade
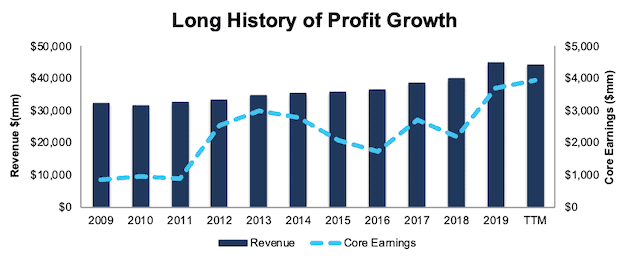
Allstate has a strong history of profit growth. Over the past decade, Allstate has grown revenue by 3% compounded annually and core earnings[1] by 16% compounded annually, per Figure 1. Longer term, Allstate has grown core earnings by 2% compounded annually over the past two decades. The firm increased its core earnings margin from 3% in 2009 to 9% in the trailing-twelve-month (TTM) period.
Figure 1: Core Earnings & Revenue Growth Since 2009
Sources: New Constructs, LLC and company filings.
Allstate’s rising profitability helps the business generate significant free cash flow (FCF). The company generated positive FCF in each of the past nine years and a cumulative $11.5 billion (37% of market cap) over the past five years. Allstate’s $2.2 billion in FCF over the TTM period equates to a 7% FCF yield, which is significantly higher than the Insurance industry average of 1%.
Reported Results Understate True Profit Growth
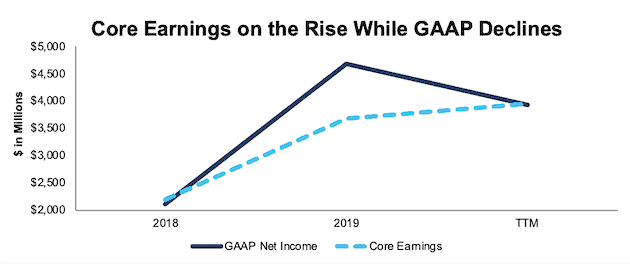
Investors only looking at GAAP net income get a misleading picture of Allstate’s true profitability. The firm’s 2019 GAAP net income was overstated by over $1 billion. This overstatement makes it appear as if GAAP net income fell significantly in the TTM period, when in fact, TTM core earnings have increased year-over-year (YoY), per Figure 2.
Figure 2: Core Earnings Vs. GAAP Net Income Since 2018
Sources: New Constructs, LLC and company filings.
Notable unusual income in ALL’s 2019 10-K include:
- $1.1 billion in equity securities appreciation recognized in net income – Page 148
- $149 million in net non-operating net periodic benefit gain hidden in operating items – Page 202 – which consists of:
- $403 million expected return on plan assets gain
- $240 million in interest costs for pension benefits
- $14 million in interest costs for postretirement benefits
In total, we identified $1 billion in net unusual income in ALL’s 2019 GAAP results. After removing this earnings distortion, we find that ALL’s 2019 core earnings of $3.7 billion are less than GAAP net income of $4.7 billion.
However, over the TTM period, Allstate reported over $1 billion in non-operating expenses, which artificially reduce GAAP net income, thereby making the firm’s profitability look worse than its true profits. Notable unusual expenses include:
- $318 million in pension and other post retirement remeasurement losses
- $210 million in shelter-in-place payback expenses
After all adjustments, we find that while Allstate’s GAAP net income fell from $4.7 billion in 2019 to $3.9 billion TTM, while core earnings actually improved from $3.7 billion to $3.9 billion over the same time.
Allstate’s Balance Sheet Provides Funds to Survive the Crisis
There’s no doubt that firms across the globe will face tough financial times in the near future. Consumers are driving less, which lowers demand for car insurance. Those that have lost jobs may need to skip payments on policies, thereby lowering insurers’ premium revenue. While weaker providers may be stretched financially, Allstate’s conservative investment portfolio, along with available liquidity, position it to survive the expected economic decline.
Allstate’s balance sheet is well positioned to withstand tough times in the short-term. The firm’s quick ratio, which measures the ability to meet short-term obligations with its most liquid assets, sits at 1.13 TTM, which is much improved from 0.96 in 2008.
The firm has $8.8 billion of highly liquid securities saleable within 1 week, otherwise referred to as “readily available liquidity” that could cover total monthly expenses for three months in a zero revenue scenario. We believe a zero revenue scenario is highly unlikely and only present it to quantify the firm’s liquidity. Even during the Great Recession, Allstate generated nearly $29 billion in insurance premiums (between property-liability and life and annuity) in 2008, which was a 1% decline from 2007.
Further bolstering the firm’s financial condition, Allstate reduced public equity exposure by ~$4 billion in February, which helped minimize investment losses during the market selloff in March. At the end of March 2020, public equity securities represented just 13% of the firm’s investment portfolio, down from 18% at the end of 2019.
Despite the economic downturn brought on by COVID-19, Allstate’s business remains in a strong financial position.
A Competitive Advantage in All Economic Cycles – Profitability Ranks Higher Than Peers
Allstate’s profitability was trending higher and at a faster pace than its peers before the crisis. In our initial report, we noted how Allstate’s strict underwriting thresholds may limit growth in the short term, but create a more profitable business long term. High profitability positions the firm to survive the current crisis and take share left by those firms that don’t survive.
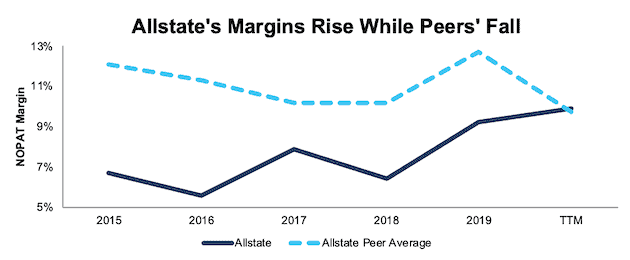
Per Figure 3, Allstate’s net operating profit after-tax (NOPAT) margin has improved from 6% in 2015 to 9% TTM. Meanwhile, the market-cap weighted average of the 40 Insurance peers under coverage has fallen from 12% to 9% over the same time. Peers in the group include The Progressive Corp (PGR), The Travelers Companies (TRV), The Hanover Insurance Group (THG), and more.
Figure 3: NOPAT Margin Vs. Insurance Peers
Sources: New Constructs, LLC and company filings.
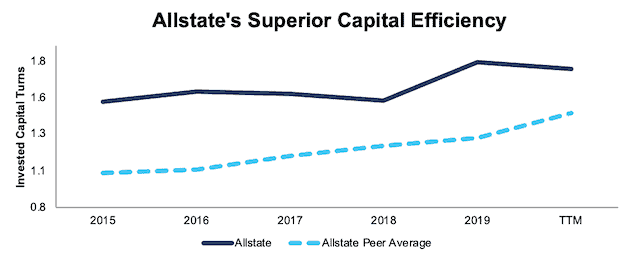
Allstate’s capital efficiency is greater than peers’. Per Figure 4, Allstate improved its invested capital turns from 1.5 in 2015 to 1.7 TTM. Meanwhile, the market-cap-weighted average of peers sits at 1.4 over the TTM period.
Figure 4: Invested Capital Turns Vs. Insurance Peers
Sources: New Constructs, LLC and company filings.
The combination of rising margins and invested capital turns drives Allstate’s return on invested capital (ROIC) higher. Allstate has improved its ROIC from 9% in 2015 to 16% TTM. Per Figure 5, the market-cap-weighted average ROIC of Allstate’s peers has improved at a slower pace, from 10% to 12% over the same time.
Figure 5: ROIC vs. Insurance Peers
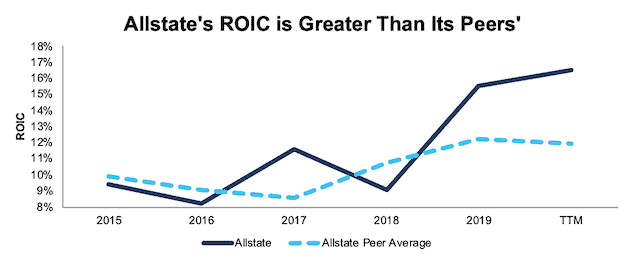
Sources: New Constructs, LLC and company filings.
Unless you believe that there will be no need for insurance in the post-COVID-19 world, it’s hard to argue against Allstate’s ability to survive. And, if it survives, it’s hard to argue that the firm’s superior profitability before the crisis will not translate into market share and profit growth after the crisis.
Disciplined Underwriting Aided by Technology
When underwriting insurance, it is paramount to build precise risk analysis models to accurately price any policy. An insurers ability to manage risk will directly reflect upon its ability to generate consistent profits. Allstate management recognizes the importance of using technology and data to build better risk analysis models and leverage insights to create a more profitable business model.
For instance, Allstate founded Arity in 2016, which uses Allstate’s many decades worth of driving behavior data to provide personalized dynamic pricing for insurance policies that take into account how much a consumer drives, where they drive, and how they drive. This data on individual customers can then be applied across entire markets to better manage risk.
Allstate’s falling combined ratio shows the firm’s track record of intelligently assessing risk, through the aid of technology and data. The combined ratio measures the amount an insurer is paying on claims compared to the amount its bringing in from premiums. A ratio below 100 means that Allstate receives more in premiums than it pays out in losses. Per Figure 6, Allstate’s property-liability combined ratio has improved from 96.2 in 2009 to 84.9 in 1Q20. For reference, PGR and TRV, the first and third largest property & casualty insurance firms by market cap, had combined ratios of 86.9 and 95.5 respectively in 1Q20.
Figure 6: Combined Ratio Since 2009
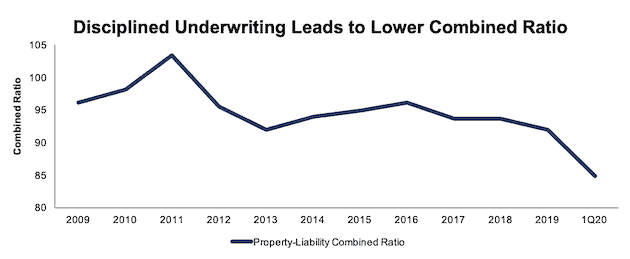
Sources: New Constructs, LLC and company filings.
COVID-19 Pandemic Won’t Eliminate Demand for Insurance Over the Long Term
In the short-term, the COVID-19 pandemic’s impact on the insurance industry is yet to be seen. On one hand, demand for policies is likely to fall, given that consumers are driving less while under stay-at-home orders and forgoing large purchases such as new homes. However, on the flip side, less driving should result in fewer accidents, which will lower claims and loss costs. Per Figure 7, Auto insurance premiums represent 69% of Allstate’s “Allstate Protection” segment revenue in 1Q20. Allstate Protection, which includes the Allstate, Encompass and Esurance brand, and Answer Financial businesses, represents 88% of Allstate’s total revenue in 1Q20.
Figure 7: Majority of Allstate’s Premiums are Auto Insurance
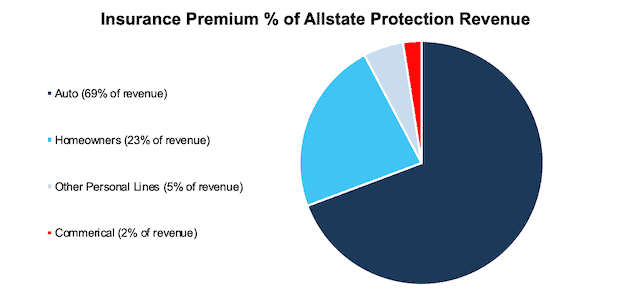
Sources: New Constructs, LLC and company filings.
Despite the clear economic downturn brought on by the crisis, consumer activity is already showing signs of growth in recent weeks. According to John Burns Real Estate Consulting, which tracks homebuilders nationwide, new home sales have started to climb from the depths of early April. Additionally, consumers are getting out on the road more often. As noted in its 1Q20 earnings call, Allstate’s data indicates the number of miles driven fell significantly in March. Since early April though, miles driven has steadily increased and ~21% of drivers are driving more than they did in mid-March.
The largest impediment to Allstate’s future growth would be a permanent and severe decline in the number of cars on the road. However, prior to the COVID-19 pandemic, Bloomberg New Energy Finance estimated that the total passenger vehicle fleet across the globe would rise from ~1.2 billion vehicles in 2019 to ~1.68 billion vehicles in 2040. Even if this growth forecast is slowed post COVID, it’s clear the need for car insurance will not simply evaporate as Allstate’s stock price implies.
Furthermore, the International Monetary Fund (IMF) and nearly every economist in the world believe the global economy will grow strongly in 2021. The IMF estimates the global economy will expand by 5.8%, and the U.S. economy by 4.7%, in 2021. The overall growth in the economy should lead to increased demand for insurance products as consumers escape the confines of their neighborhoods and enjoy leisure travel once more.
ALL Trades at Cheapest Level Since 2012
After falling 16% YTD to $95/share, ALL now trades at its cheapest price-to-economic book value (PEBV), 0.4, since 2012. This ratio means the market expects Allstate’s NOPAT to permanently decline by 60%. This expectation seems overly pessimistic over the long term.
ALL’s current economic book value, or no-growth value, is $216/share – a 127% upside to the current price.
Figure 8: Stock Price vs. Economic Book Value (EBV)
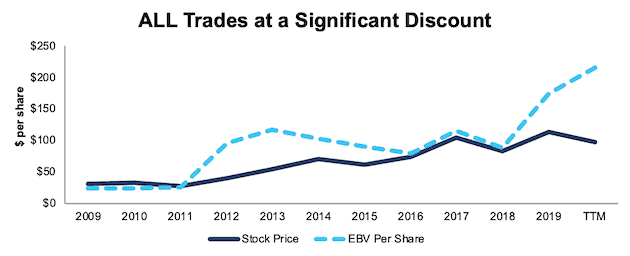
Sources: New Constructs, LLC and company filings.
Current Price Implies Economic Crisis Similar to 2008
Below, we use our reverse DCF model to quantify the cash flow expectations baked into Allstate’s current stock price. Then, we analyze the implied value of the stock based on different assumptions about COVID-19’s impact on the insurance industry and Allstate’s future growth in cash flows.
Scenario 1: Using historical revenue declines and margins, we can model the worst-case scenario already implied by Allstate’s current stock price. In this scenario, we assume:
- NOPAT margins fall to -6% (all-time company low in 2008) in 2020 before rebounding to 3% (company low excluding 2008) in 2021-2024 and to 6% (10-year average) in 2025 and each year thereafter
- Revenue falls 20% in 2020, (equal to the YoY decline from 2007 to 2008) and doesn’t grow again until 2025
- Revenue begins growing again in 2025, but only at 3% a year, which equals Allstate’s revenue compound annual growth rate (CAGR) over the past decade
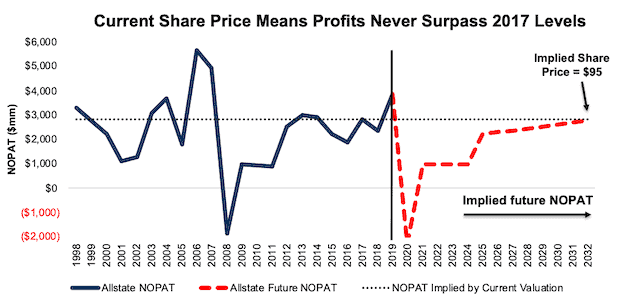
In this scenario, Allstate’s NOPAT declines 2% compounded annually (including 158% YoY in 2020) over the next 13 years, the stock is worth $95/share today – equal to the current stock price. See the math behind this reverse DCF scenario. The decline in profitability in 2008 was not only due to the economic crisis, but also a more than doubling in catastrophe losses than the year before, due to hurricane Ike and Gustav. Such an occurrence looks unlikely, at least due to COVID-19. As noted earlier, claims and loss costs could actually decline during and after the COVID-19 pandemic, as drivers use their cars less. This scenario represents a truly worst case to illustrate the pessimistic expectations baked into ALL.
Figure 9 compares the stock’s implied future NOPAT to the firm’s historical NOPAT in this scenario. This worst-case scenario implies Allstate’s NOPAT 13 years from now will be 27% below its 2019 NOPAT. In other words, this scenario implies that 13 years after the COVID-19 pandemic, Allstate’s profits will have only recovered to levels seen in 2017, 2014 and 2003. Per Figure 9, Allstate earned NOPATs above this implied level in multiple years through its history. In any scenario better than this one, ALL holds significant upside potential, as we’ll show below.
Figure 9: Current Valuation Implies Severe, Long-Term Decline in Profits: Scenario 1
Sources: New Constructs, LLC and company filings.
Scenario 2: Big Upside Without a Full Recovery
If we assume, as does the IMF and nearly every economist in the world, that the global economy grows strongly in 2021, ALL is highly undervalued.
In this scenario, we assume:
- NOPAT margins fall to 3% (all-time company low, excluding 2008) in 2020 and rebound to 7% (all-time company average) in 2021 and each year thereafter
- Revenue falls 20% in 2020 – equal to the YoY revenue decline from 2007-2008
- Revenue growth returns in 2021 at the IMF’s global base-case GDP growth rate of 5.8%
- Revenue grows at 3% a year thereafter, which equals Allstate’s revenue CAGR over the past decade
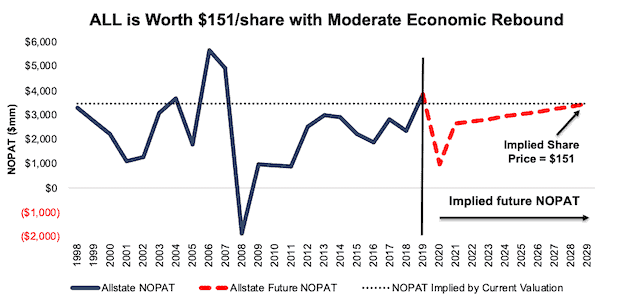
In this scenario, Allstate’s NOPAT falls 1% compounded annually (including 75% YoY in 2020) over the next decade, and the stock is worth $151/share today – a 59% upside to the current price. See the math behind this reverse DCF scenario.
For comparison, Allstate has grown NOPAT by 15% compounded annually over the past decade and 2% compounded annually over the past two decades. Furthermore, Allstate’s 5-year average NOPAT has improved from $2.1 billion in 2014 to $2.7 billion TTM (details in the Appendix). It’s not often investors get the opportunity to buy an industry leader at such a discounted price.
Figure 10 compares the stock’s implied future NOPAT to the firm’s historical NOPAT in scenario 2. This scenario implies that ten years from now, the firm’s NOPAT will be 16% below its 2019 level, and just nearly equal to the NOPATs earned in 1998 and 2004. If the firm’s profits fully recover to its 2019 levels, ALL has even more upside potential.
Figure 10: Implied Valuation with Prolonged Recovery: Scenario 2
Sources: New Constructs, LLC and company filings.
Sustainable Competitive Advantages Will Drive Shareholder Value Creation
Here’s a summary of why we think the moat around Allstate’s business will enable it to continue to generate higher NOPAT than the current market valuation implies. The following competitive advantages help Allstate survive the downturn and return to growth as the economy grows again:
- Ample liquidity to survive the dip
- Leveraging data to better manage and price risk
- Prudent underwriting creates highly profitable property-liability business
- Superior profitability to peers
What Noise Traders Miss with Allstate
These days, fewer investors focus on finding quality capital allocators with shareholder-friendly corporate governance. Instead, due to the proliferation of noise traders, the focus is on short-term technical trading trends while high-quality fundamental research is overlooked. Here’s a quick summary of what noise traders are missing:
- Consistent core earnings growth over the past decade
- Long-term demand for insurance, particularly car insurance
- Valuation implies the economy, and the insurance industry alongside it, never recovers from COVID-19
Executive Compensation Plan Could Be Improved
Allstate’s incentive awards include a short-term cash portion and long-term equity portion paid in performance stock and stock options. The annual cash awards are tied to meeting target annual premiums, performance net income, and investment net income. The performance stocks awards are tied to three-year performance net income return on equity and relative total shareholder return.
We would prefer Allstate tie performance compensation to improvement in ROIC, as there is a strong correlation between improving ROIC and increasing shareholder value. Tying executive compensation to ROIC also ensures that executives’ interests are properly aligned with shareholders’ interests.
Despite using flawed metrics for measuring performance, Allstate’s plan has not compensated executives while destroying shareholder value. Allstate grew economic earnings by 9% compounded annually over the past five years and 3% compounded annually over the past two decades.
Dividend and Buybacks Provide Over 8% Yield
Allstate increased its dividend in each of the past 10 years and has grown its annual dividend by 14% compounded annually since 2015. Allstate’s present annualized dividend of $2.16/share provides a 2.3% yield. In the past, Allstate has generated ample free cash flow sustain and grow its dividend. In the last five years, Allstate generated far more in free cash flow ($11.5 billion) than it has paid out in dividends ($3.4 billion), or an average $1.6 billion surplus each year.
In addition to dividends, Allstate regularly returns capital to shareholders through share repurchases. In its 1Q20 earnings call, the firm noted it plans to continue its share repurchase program and expects to complete it by the end of 2021. At the end of 1Q20, Allstate had $2.8 billion remaining under its current repurchase authorization.
If we assume Allstate spreads this repurchase authorization out over the 7 quarters through the end of 2021, the firm would repurchase $1.7 billion in 2020, which includes the $511 million repurchases in 1Q20. Such repurchases would represent 5.9% of Allstate’s current market cap, which, when combined with Allstate’s dividend, provide an 8.2% yield to investors.
A Consensus Beat or Signs of Recovery Could Send Shares Higher
According to Zacks, consensus estimates at the end of 2019 pegged Allstate’s 2020 EPS at $10.14/share. Jump forward to May 14, and consensus estimates for Allstate’s 2020 EPS have increased to $11.12/share. Despite rising expectations, indicating Allstate’s strength in a down market, the stock is down 16% YTD. The disconnect between rising consensus expectations and the expectations implied by Allstate’s stock price mean any earnings beat, especially in a turbulent market, could send shares higher.
Though our current Earnings Distortion Score for Allstate is “In-Line”, Allstate beat EPS estimates in nine of the past 12 quarters, and doing so again, after increased consensus expectations, could send shares higher.
Additionally, any signs of an economic recovery, particularly in the workforce, to ensure consumers can pay their bills, including insurance policies, would be welcome news.
Insider Trading and Short Interest Trends
Over the past 12 months, insiders have bought a total of 366 thousand shares and sold 1.4 million shares for a net effect of 1 million shares sold. These sales represent less than 1% of shares outstanding.
There are currently 3.1 million shares sold short, which equates to 1% of shares outstanding and one day to cover. Short interest is down 12% from the prior month, which indicates investors aren’t buying into the pessimistic expectations baked into Allstate’s stock price.
Critical Details Found in Financial Filings by Our Robo-Analyst Technology
As investors focus more on fundamental research, research automation technology is needed to analyze all the critical financial details in financial filings as shown in the Harvard Business School and MIT Sloan paper, "Core Earnings: New Data and Evidence”.
Below are specifics on the adjustments we make based on Robo-Analyst findings in Allstate’s 2019 10-K:
Income Statement: we made $2.3 billion of adjustments with a net effect of removing $812 million in non-operating income (2% of revenue). See all adjustments made to Allstate’s income statement here.
Balance Sheet: we made $5.2 billion of adjustments to calculate invested capital with a net decrease of $555 million. One of the most notable adjustments was $2.6 billion (10% of reported net assets) in other comprehensive income. See all adjustments to Allstate’s balance sheet here.
Valuation: we made $4.5 billion of adjustments with a net effect of decreasing shareholder value by $4.5 billion. There were no adjustments that increased shareholder value. The most notable adjustment to shareholder value was $2 billion in preferred stock. This adjustment represents 7% of Allstate’s market cap. See all adjustments to Allstate’s valuation here.
Attractive Funds That Hold ALL
The following funds receive our Attractive-or-better rating and allocate significantly to Allstate.
- Invesco KBW Property & Casualty Insurance (KBWP) – 8.8% allocation and Very Attractive rating.
- iShares U.S. Insurance ETF (IAK) – 6.6% allocation and Attractive rating.
- Fidelity Insurance Portfolio (FSPCX) – 6.0% allocation and Attractive rating.
- Advisors series Edgar Lomax Value Fund (LOMAX) – 5.5% allocation and Very Attractive rating.
- AmericaFirst Large Cap Share Buyback Fund (SBQIX) – 4.3% allocation and Attractive rating.
- Homestead Value Fund (HOVLX) – 4.1% allocation and Attractive rating.
Appendix
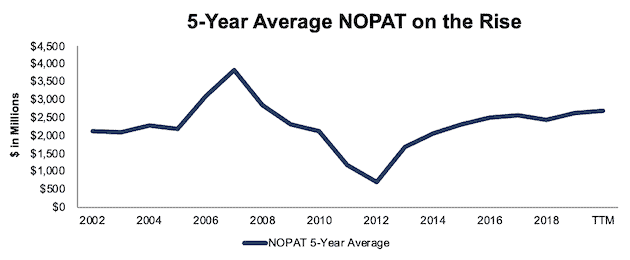
Figure I shows Allstate’s 5-year average NOPAT since 2002, which is the earliest date in our model. 5-year average NOPAT smooths the year-to-year fluctuations in profitability and provides a clearer look at the firm’s consistent profitability. As can be seen in Figure I, Allstate has consistently improved its NOPAT since 2012.
Figure I: 5-Year Average NOPAT Since 2002
Sources: New Constructs, LLC and company filings.
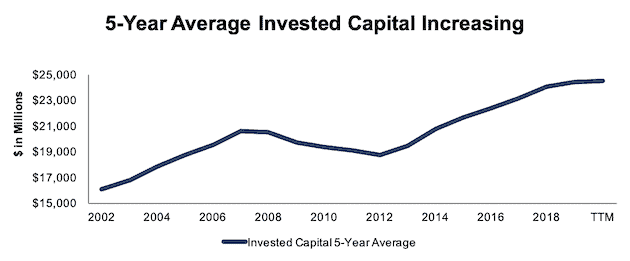
On top of profit growth, Allstate has steadily increased the capital invested into its business, per Figure II, which shows Allstate’s 5-year average invested capital since 2002.
Figure II: 5-Year Average Invested Capital Since 2002
Sources: New Constructs, LLC and company filings.
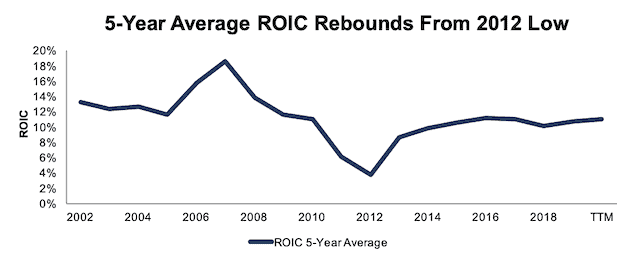
Most importantly, Allstate successfully deploys the capital generated into its business to generate greater profits. Per Figure III, Allstate has significantly improved its 5-year average ROIC from 4%, the low of 2012, to 11% TTM.
Figure III: 5-Year Average ROIC Since 2002
Sources: New Constructs, LLC and company filings.
[1] Our core earnings are a superior measure of profits, as demonstrated in In Core Earnings: New Data & Evidence a paper by professors at Harvard Business School (HBS) & MIT Sloan. The paper empirically shows that our data is superior to “Income Before Special Items” from Compustat, owned by S&P Global (SPGI).
Disclosure: David Trainer, Kyle Guske II, and Matt Shuler receive no compensation to write about any specific stock, style, or theme.


