
Generals Marching Without Soldiers
In 1980, when I came into the investment business, investors were very conscious of trading ranges that had existed the prior 16 years:
(Click on image to enlarge)
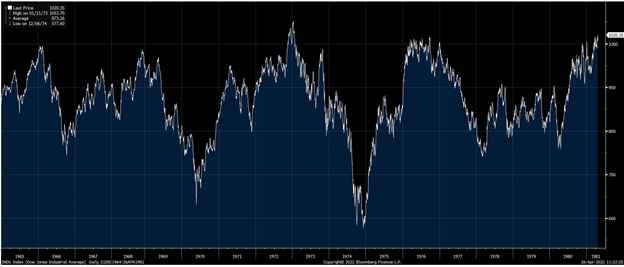
Since the stock market was range-bound, technical analysis became very popular. The two most popular were the Zweig Forecast (Marty Zweig) and the Professional Tape Reader (Stan Weinstein). The opinions were available Friday afternoon via a phone service which provided a tape recording of their latest findings. One of their favorite sayings was, “Be nervous when the Generals are marching forward and the troops aren’t following.”
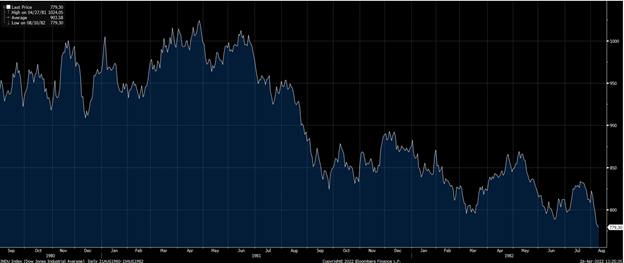
The breadth of the stock market narrows, but the index continues to climb or go sideways despite the fact that the majority of stocks are declining. This was true in 1980 and it preceded the 1981-1982 bear market, which hit a greater than 20% decline even though the index was historically cheap already.
(Click on image to enlarge)
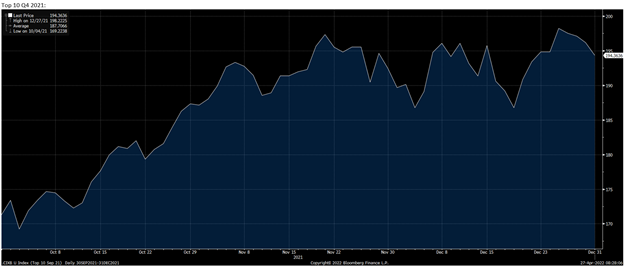
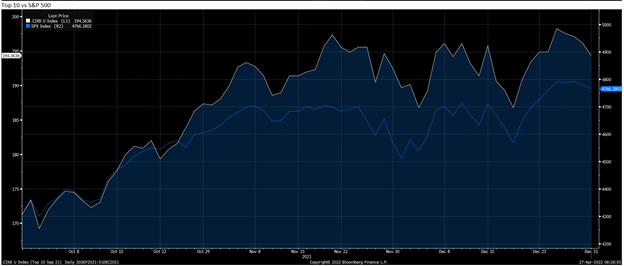
This brings us to today’s circumstances. Some very large companies with an inordinately large market cap in the S&P 500 Index have held up quite admirably.
(Click on image to enlarge)
While the broader S&P 500 Index, as measured by the other 490 stocks, began to get severely battered:
(Click on image to enlarge)
To gain historical perspective, let’s look at other times when the Generals were continuing to march and the troops weren’t following.
Dow Jones, S&P 500, and Russell 2000 from January 1, 1987 – August 25, 1987:
(Click on image to enlarge)
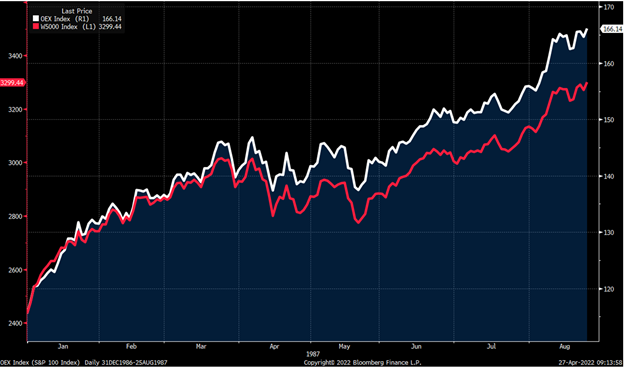
The broader list of stocks was already foreshadowing the coming decline in the Index.
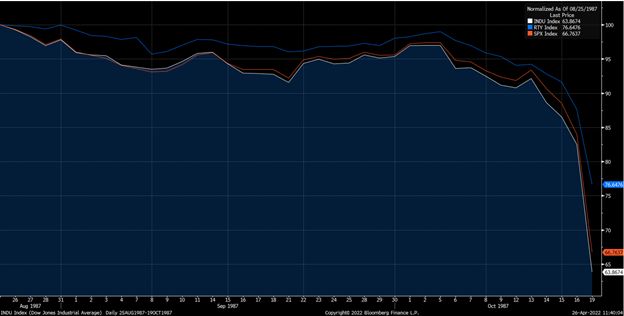
Dow Jones and S&P 500 from August 25 – October 19, 1987:
(Click on image to enlarge)
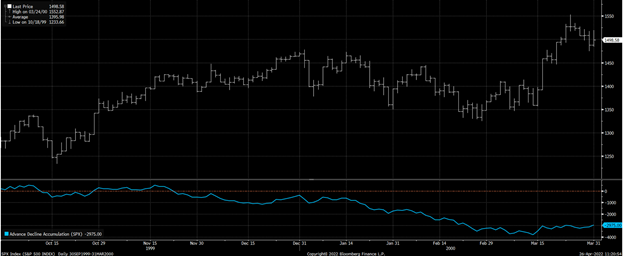
The Dotcom Bubble of 1999-2000 was another terrific example of Generals in the form of tech and telecom stocks marching forward:
(Click on image to enlarge)
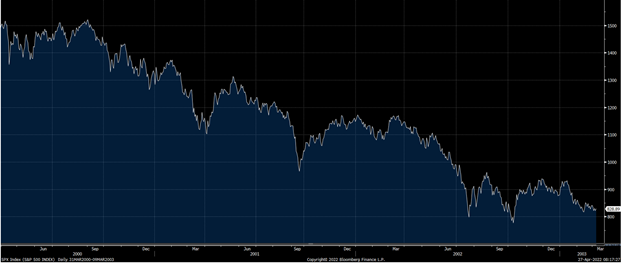
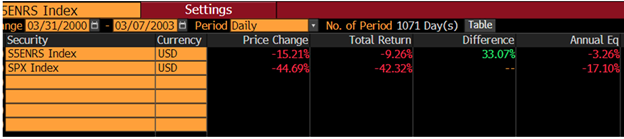
The S&P 500 got slaughtered from March 31, 2000, to March 9, 2003. See the chart below:
(Click on image to enlarge)
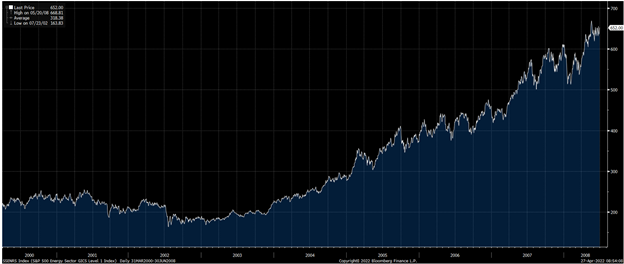
There is a slice of good news during this depressing rundown on the present reality. Here is how the energy sector of the S&P 500 Index did in the 2000-2003 bear market:
Oil bottomed in 2000 at around $10 per barrel, much like oil bottomed in March of 2020 when the Arab Spring cut the legs off the U.S. oil production. The story only got better through the first half of the devastating bear market in 2007-2008 as energy prices soared:
(Click on image to enlarge)
While we have used the rhyme of the oil business to defend our capital in the energy sector, most investors have used the decline that we are in currently to snuggle more heavily up to the Apples and Amazons of the S&P 500, even as they vomit out of the hyper-aggressive darlings of the last two years:
(Click on image to enlarge)
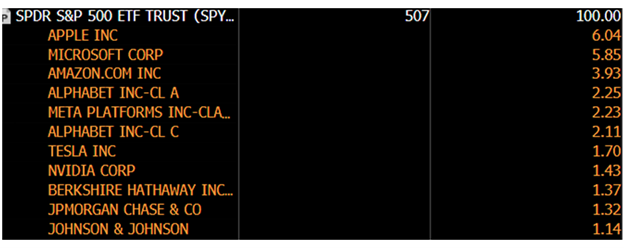
This leaves investors heavily committed (29.5% of the S&P 500 Index) to a narrow group of stocks dominated by tech darlings even as bombs are dropping on almost all other tech companies as a category. In other words, tech Generals are marching forward, and few troops are following. As history teaches us, the S&P 500 Index returns could well be prepared to produce “stock market failure” in the form of negative ten-year returns. As always, fear stock market failure.
Disclosure: The information contained in this missive represents Smead Capital Management’s opinions, and should not be construed as personalized or individualized investment advice and ...
more

