General Electric After Its Big 2018 Dividend Cut
From time to time, we test drive new forecasting methods for stock prices to see how they perform.
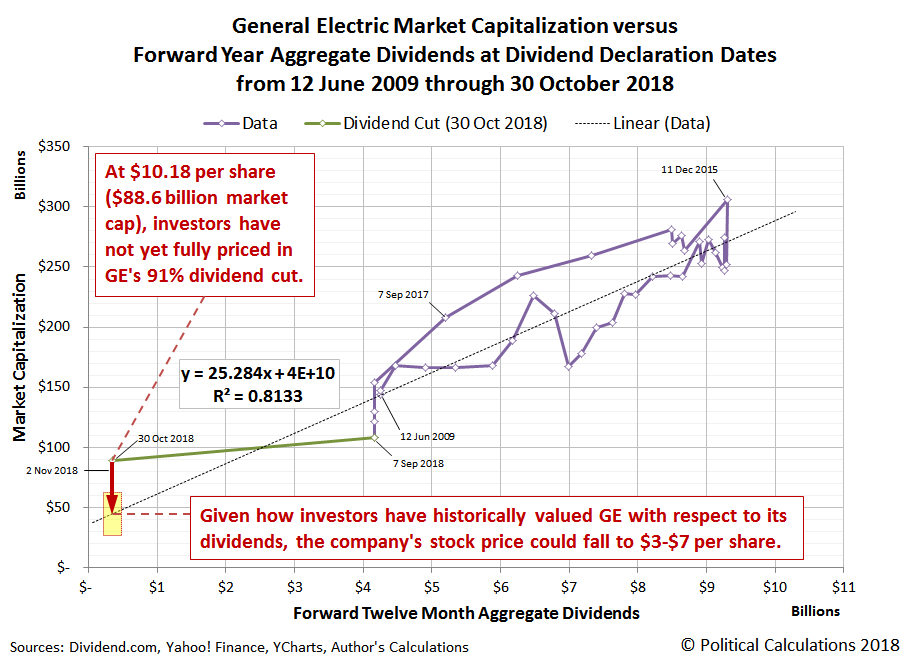
Back in early November 2018, we presented a prediction for what would happen with the share price of General Electric (GE) based on a relationship between its expected future dividends and its market cap. Let's quickly recap that old forecast:
Now that General Electric has slashed its quarterly dividend by 91%, from $0.12 to $0.01 per share, which we estimate is about 50% more than what investors had already priced in to the stock, what can they expect next for the company's share price?
Based on the historic relationship that investors have set between the company's market capitalization and its aggregate forward year dividends since 12 June 2009, we would anticipate GE's share price falling to somewhere within a range of $3 to $7.
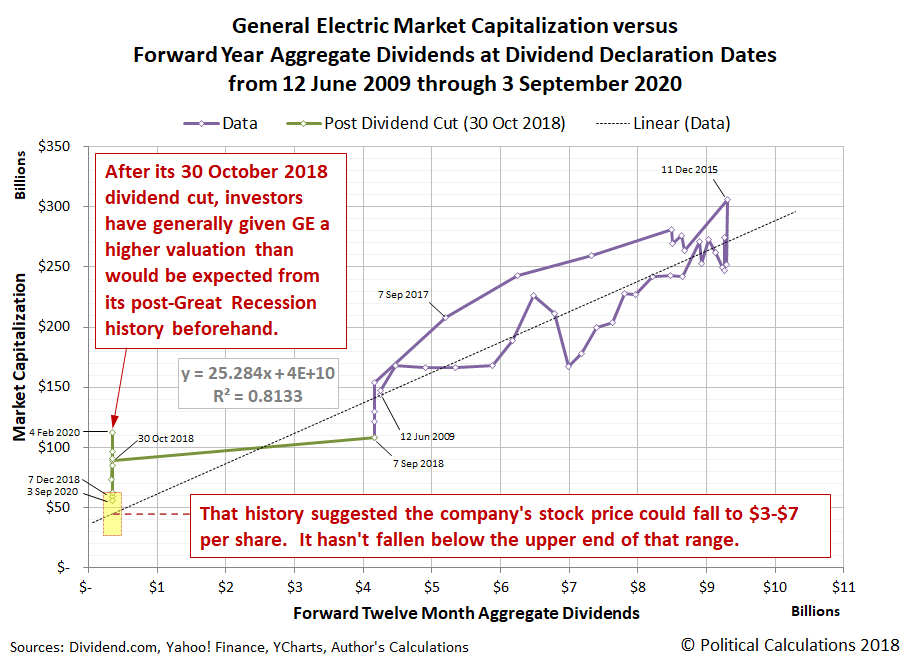
Almost two years later, we can see how well the forecasting method we were testing worked, updating that original chart to show how history played out. The new chart catches the data up through 3 September 2020 to coincide with the date of GE's most recent dividend declaration:
It didn't take long for GE to prove that prediction right, with its market cap dropping within the top end of our target range in a month's time.
But that outcome didn't last very long. Soon, GE's stock price rose above the range we had projected using nine years worth of historical data, staying well above it for a prolonged period of time. It took the onset of today's Coronavirus Recession to drop GE's market cap back within that target range. Even so, GE's market cap hasn't fallen below the midpoint of that range during any of that time, which means the method we used set the target too low.
Being able to connect a company's expected forward year aggregate dividends to its market capitalization to forecast its stock price could be a valuable way of determining whether its current share price presents a buying or a selling opportunity. Doing a better job in setting the target would better indicate which kind of investing opportunity might exist at any given time.
We have an idea for how to improve our result, which we'll explore more in upcoming weeks. To test it out though, we'd like to look at some other stock than GE, since we don't expect the company will be changing its dividend payouts anytime soon. If you have a candidate for us to consider, please drop us a line!
References
Dividend.com. General Electric Dividend Payout History. [Online Database]. Accessed 22 September 2020.
Ycharts. General Electric Market Cap. [Online Database]. Accessed 22 September 2020.
Yahoo! Finance. General Electric Company Historical Prices. [Online Database]. Accessed Accessed 22 September 2020.
Disclaimer: Materials that are published by Political Calculations can provide visitors with free information and insights regarding the incentives created by the laws and policies described. ...
more


