
Friday The Thirteenth And The Roof Is On Fire
Hourly ES S&P 500 Futures Chart
As fast as they have come down, they have gone up twice as fast overnight. The S&P futures are now up 200 points from the low, as of 7:45 AM in New York. That’s 8% in a few hours. What a world.
Liquidity moves markets!
The futures are also now limit up from yesterday’s close. That limit is 5% in hours when the market is closed. Then it increases to 7% when New York opens. So don’t be surprised to see an opening around 2650. That, by the way, is also the location of a key trendline in the opening hour.
If they clear that, we’d be looking at 2700-2710.
Wouldn’t it be funny if the market got back to 3000 next week. It would be a 20% gain, and the pundits would be scratching their heads and their butts wondering whether to call a bull market after a 2-week bear market. Ah, the 20% Rule, from the Wall Street Bureau of Weights, Measures, and Dumb Propaganda.
Meanwhile, we also need to keep an eye on the overnight uptrend line, which in the next hour will be at roughly 2585-90. It will be around 2610-20 in the NY opening hour. If that’s broken, I’d look for at least a 50% retracement of the pop, to somewhere around 2500, give or take a thousand.
I’d add a LOL if it weren’t so sick.

Momentum and cycle indicators turned up off mostly flat bottoms. Only momo had a slight positive divergence. Is it enough to support a good low? Not usually, but in this case, whoTF knows. I think we need a test at the very least.
Reminder- I’m only talking a day or so. This is not the big picture. If you want that story, you must subscribe. Risk-free trial and all.
So now, we have the expected 3-5 day cycle low. What about the next high? Could be later today, or Monday.
Our watchword for the past week: “There are no ‘oversold’ parameters in a crash. Indicators may rebound while prices have a dead cat bounce, then they both crash again.”
The cat bounced, pretty much on time. But he’s still a zombie until proven otherwise.
China Stock Market Overnight
Shag High crashed and recovered. It’s smack in the middle of its one-year trading range. Gaps and wild moves all over the place. The chart isn’t speaking to me. Well, it’s speaking, but it’s speaking in tongues and I can’t understand a word.

S&P Futures Daily Chart
So what about the daily chart. We’re looking at it for the perspective of one day only. Again, the purpose of these reports is not to divine the longer term. If you want longer horizons, join me at Liquidity Trader.
First, the latest and sharpest crash channel remains intact. It’s so sharp that it’s hard to tell just what the market would need to do today to clear it, but let’s say 2750 give or take 50. Anything less than that, and the crash will probably resumes and hit new lows lickety-split.
We got the expected support at 2450 with a little bending but not breaking. If they drop under 2400, then 2317 would be the target. Below that, abandon hope, all ye who enter.
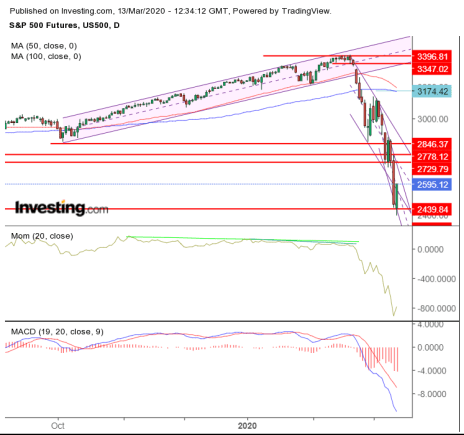
The daily chart indicators remain cataclysmic. They still show no sign of a bottom whatsoever, the tiny uptick in momentum, notwithstanding.
Department of Wash, Rinse Repeat – There’s no oversold parameter in a crash. Positive divergences are almost certainly necessary to form a good swing low. There are no positive divergences on the daily chart yet.
S&P Cash Index Hourly Chart
The red bar at the far right is where the futures have been trading this morning. The range is 2395 to 2595. It covers the entire downtrend channel of the past two days.
With the likelihood of a limit up move on the open, the channel would be broken. To finish the breakout, the SPX would need to be above 2600 at 10 AM. Then it would target 2650 and 2675.
On the downside, I would not expect support anywhere in the range down to 2400. That’s not to say the market couldn’t bottom in the range. It’s just not possible to divine a likely target, although traders do love round numbers.

“And that’s the way it is, Friday, March 13, 2020.”
From Zagreb, Croatia, good morning!
Where have you gone, Walter Cronkite? Our nation turns its lonely eyes to you.
Meanwhile, here are the latest reports from Liquidity Trader.
Lock Limit Down – Monday
The S&P futures are trading limit down at 2812 as I write this at 2:50 AM Eastern Time in the US.
I suspect that the PPT will be in action over the next few hours. Whether they’ll be able to get it above support at 2850 or not is the question. And if they do, can they keep it there? If they fail, then we’re in line for an epic crash.
The cycle lineup suggests a low now, at least after this morning’s crash burns out. Here’s what to look out for.
Disclosure: None.


