
Ford Motor Kicks It Into High Gear: Where Is The Stock Headed Next?

On Thursday, Ford Motor Co F broke up from a bull flag formation on the daily chart Benzinga called out Oct. 1 and on Friday the stock was motoring a further 3% north.
The automaker recently announced plans to invest billions of dollars into significantly expanding its lineup of electric vehicles. The plan includes building its largest-ever factory, as well as two battery factories.
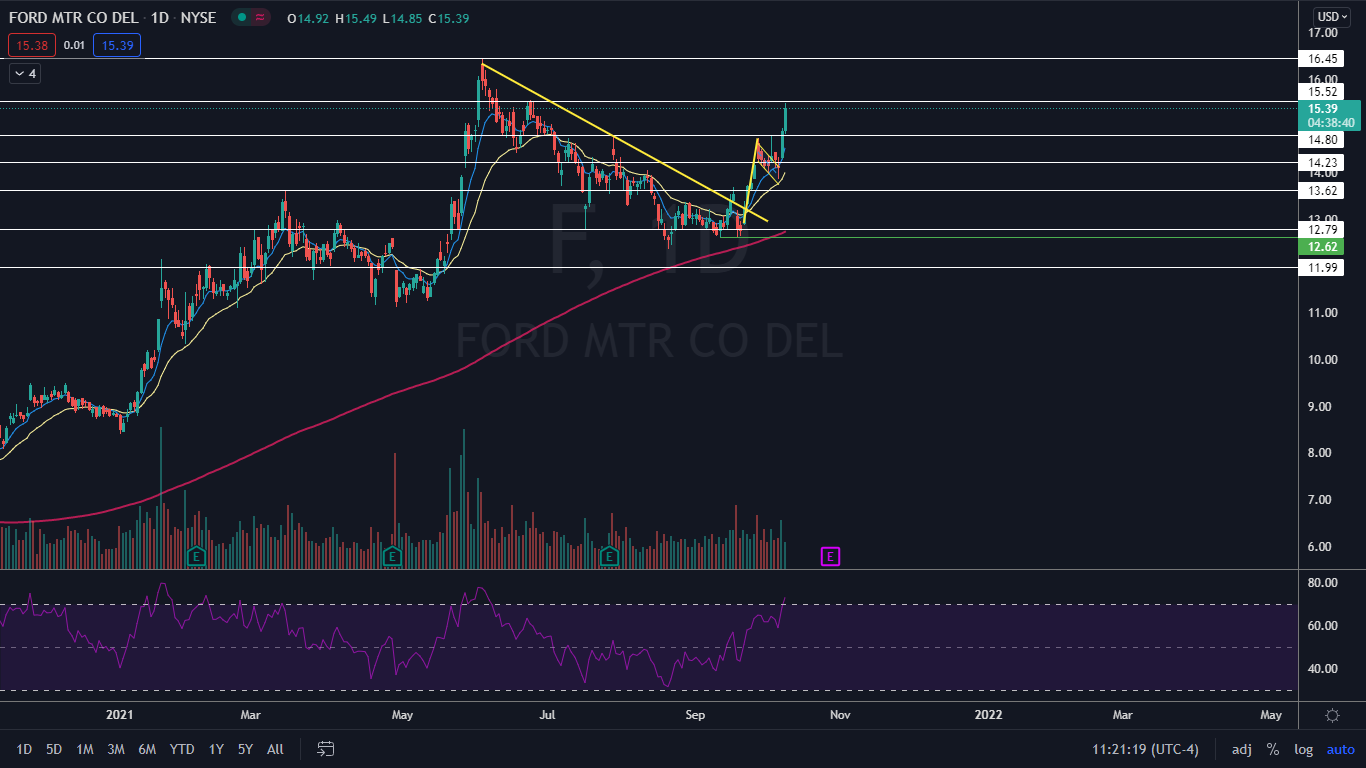
The Ford Chart: Ford closed Thursday's session just above a resistance level at the $14.80 mark and on Friday the stock backtested the level as support. Big bullish volume came in Friday morning and drove the stock up to a higher resistance zone at $15.52 where Ford wicked from the level and began to consolidate on lower timeframes.
If Ford closes the trading day near its high-of-day price, it will print a big bullish Marubozu candlestick. This could indicate higher prices are in the cards for Monday, although bullish traders will want to watch the stock doesn’t remain overextended.
Ford’s relative strength index (RSI) was measuring in at about 73%, which puts in square into overbought territory. When a stock’s RSI reaches or exceeds the 70% level, it can be a sell signal for technical traders, although it should be noted an RSI can stay overextended for a long period of time.
The stock is trading above the eight-day and 21-day exponential moving averages (EMAs), with the eight-day EMA trending above the 21-day, both of which are bullish indicators. Ford is also trading well above the 200-day simple moving average, which indicates overall sentiment in the stock is bullish.
- Bulls want to see some consolidation take place to drop the stock’s RSI back down below 70%, and then for big bullish volume to come in and drive the stock up above the overhead resistance. If the stock can regain the $15.50 level as support, it has room to trade up toward $16.45.
- Bears want to see Ford continue to reject the resistance and then for big bearish volume to come and drop the stock back down below the $14.80. Below the level, the stock has support at $14.23 and $13.62.
(Click on image to enlarge)
Disclosure: © 2021 Benzinga.com. Benzinga does not provide investment advice. All rights reserved.


