
Five Lessons For Understanding This Market
I ended last week's missive with the words, "So, from my seat, some caution remains warranted." Silly me. What was I thinking?
To be honest, I was thinking that the market's recent joyride to the upside, which, as of Friday, has produced gains of 42.8% from the low on the S&P 500, 45.8% on the DJIA, 40.5% on the Nasdaq 100, 50.3% on the IWM (Russell 2000 Small Cap ETF), and an eye-popping 57.8% on the MDY (SPDR S&P 400 Midcap ETF), was getting a little frothy. No, let's make that a lot frothy.
The S&P responded to my cautious tone with a remarkable gain of +4.9% on the week. Don't look now fans, but the venerable blue-chip index is now just 5.7% from its all-time high and is off a mere 1.14% on the year (0.26% when dividends are reinvested). So again, silly me.
Virus? What virus? We're moving on. The worst recession, maybe, ever? No worries! Twenty million unemployed? It doesn't matter, those job losses are temporary, right! The Administration renewing its fight with China? Ignore it. Unrest in the streets? Wall Street hasn't noticed.
If It's Obvious...
Given the plethora of worries, concerns, and fears out there, I guess my idea that some caution might be warranted after a monster run was, in a word, obvious. But as the late Joe (I'm The Greatest) Granville was famous for saying, "If it's obvious, it's obviously wrong!"
Clearly Friday's jobs report, which surprised to the upside and represented the biggest "miss" of all-time added fuel to the stock market's fire. Many analysts were quick to suggest that the stock market had been "sniffing out" the turnaround in the job market and thus, has been "right all along.
So, a point I'd like to make on this fine Monday is that it is SOOO easy to succumb to consensus thinking about what is happening during times like these. It's natural to say, hey, things are terrible, so stocks should go lower, not higher. Just look how bad the data is!
But - and I know this concept is tough to deal with at times - we must remind ourselves that stocks don't trade based on what is happening right now. No, everybody join in now... "Stocks are a discounting mechanism of future expectations." This means that the market has already "baked in" the bad news that you may be seeing now. So, when stocks are moving in the opposite direction of the news, it means that traders are looking ahead (and not back).
Up until Friday, this seemed like a stretch. As in a BIG stretch. One of the primary narratives in the market was the purported "disconnect" between Wall Street and Main Street. While the economy is experiencing perhaps the worst hit ever and according to the WSJ, 80% of those surveyed feel America is "spiraling out of control," the stock market has been dancing merrily higher. So, what gives?
I've been managing other people's money in the markets since 1987 and I like to think that I've learned a thing or two along the way. As such, today, I'd like to review a few of the lessons I've learned about investing that have helped me come to grips with this market.
Lesson 1: Buy When The Recession Is Official...
The first lesson relates to recessions. The rule is that a buy signal occurs when the government officially declares a recession. The idea is that by the time the data shows the economy is actually in a recession, the recession is probably over or, at the very least, closer to the end than the beginning. And since according to the computers at Ned Davis Research, a healthy chunk of a bull market's gains (approximately half) tend to occur in the first one-third of the bull market's duration, it tends to pay to get invested early.
Granted, the National Bureau of Economic Research (the keeper of the recession/expansion data) has yet to officially declare that the U.S. is in recession. However, I believe we can still apply the lesson here because just about everybody on the plant will agree that we've got a recession going. And this view started to gain traction in April, along with the stock market rally.
Lesson 2: Buy When There Is "Blood In The Street"
The second lesson is to "buy when there is blood in the street" (as in Wall Street). This is a take-off on one of Warren Buffett's rules of investing, which is to be "fearful when others are greedy and greedy when others are fearful." And since the news over the past two months has been nothing short of scary, it makes sense that traders would be looking to buy when unemployment hit record levels and economists were busy fighting over whether GDP would be down 30% or 50% in Q2.
To be sure, there was plenty of "blood" flowing in the stock market between February 19 and March 23. As such, it isn't surprising that professional investors were trying and take advantage of the carnage. For example, even yours truly was upping equity exposure in client accounts on March 23 and March 24.
But since the early days of April, it has been tough to "get in." In fact, the best the bears have been able to do since the bottom has been a two-day pullback. Oh, and there have only been four of those!
Lesson 3: Don't Fight The Fed
Another very big lesson - a lesson that seems to gain importance with each and every market crisis - is, "Don't Fight the Fed."
However, this time around, it felt like the Fed was helpless against the novel coronavirus. I was on record early in the crisis opining that the Fed couldn't fix this, only science could. Again, silly me.
You see, that was before QE4EVER began. Before the Fed changed the rules of the game and started buying securities they'd never bought before (and aren't even legally allowed to buy). Before, the alphabet soup of new programs to make sure that liquidity flowed. And before Jay Powell went on 60 Minutes and pronounced that there is "no limit" to the amount of support the Fed can provide.
One thing traders have learned since the Financial Crisis is to "shake hands with the Fed/Government." In other words, when the Fed is buying and the Government is dropping money from helicopters, you need to be buying.
Lesson 4: Money Goes Where It Is Treated Best
While on the subject of central bankers, money printing, and managed economies/markets, there is yet another lesson to review. In short, it is important to recognize that we play in a global financial system these days and that money goes where it is treated best.
A big lesson learned after Financial Crisis is that when global central bankers are all playing the QE card, a healthy amount of the newly minted cash (well, digitally minted currency, that is) winds up in the U.S. stock and bond market.
Why? Because the U.S. is the best game in town. The best bad house in the neighborhood during a crisis. The market where the big tech winners reside, which are up nicely in the face of the virus. Oh, and the only country with government bond rates that are still positive.
Therefore, money continues to flow into the U.S. stock market. Period.
Lesson 5: TINA
The last lesson worth remembering is summed up in the acronym T.I.N.A. There is no alternative. And I for one, believe this lesson applies here, big time.
Think about it. Where else are investors going to put money in a COVID world besides the U.S. stock and bond markets? Office buildings? Uh no. Apartments? Not a chance. Shopping Malls? Nope. Rental properties? A hard no. Mortgages? Please. Commodities? Heck no. Restaurants? Be serious. Gold? Okay, maybe. (But those bars are heavy and you have to put 'em somewhere!) I could go on, but you get the idea.
The key is that the U.S. stock market continues to be one of the primary investing vehicles on the planet. And money simply continues to flow in. For example, I'd be willing to bet dollars to donuts that at least a portion of your 401K contribution goes into the U.S. stock market. Every month. Like clockwork.
And guess what, when those contributions come into all those index funds that 401K sponsors love so much, that money has to be invested. As in immediately. Those managers aren't looking for the best opportunity to buy. No, they need that money in the market - now.
The point is that until there is a decent alternative for investors everywhere, money is going to continue to flow into the market. It's that simple. As such, remember that there is ongoing demand for stocks. And of course, that's before the buybacks...
Finally, To Clarify...
And finally, I'd like to clarify last week's comments urging some caution. My thinking wasn't that it was time to raise some cash. No, it was more related to the idea that the market had come a LONG way and that it might be time for a rest - so we should be ready. After all, I've read that the S&P 500 has put in the best gain over a 50+ day period in history. So, from my seat, I felt the odds were growing that something bad might come out of the woodwork. But, one more time, silly me!
Weekly Market Model Review
Each week we do a disciplined, deep dive into our key market indicators and models. The overall goal of this exercise is to (a) remove emotion from the investment process, (b) stay "in tune" with the primary market cycles, and (c) remain cognizant of the risk/reward environment.
The Major Market Models
We start with six of our favorite long-term market models. These models are designed to help determine the "state" of the overall market.
There are two changes to report on the Primary Cycle board this week. First the Leading Indicators Model improved from negative to neutral and is now just a hair away from a new buy signal. In addition, our Desert Island Modal also moved out of the red and into the neutral zone. And finally, it is worth noting that although there is only one buy signal on the board, there are no longer any sell signals and the average historical return improved from 0.9% to 11.4%. As such, I think we have to upgrade the status of the Primary Cycle board to moderately positive.
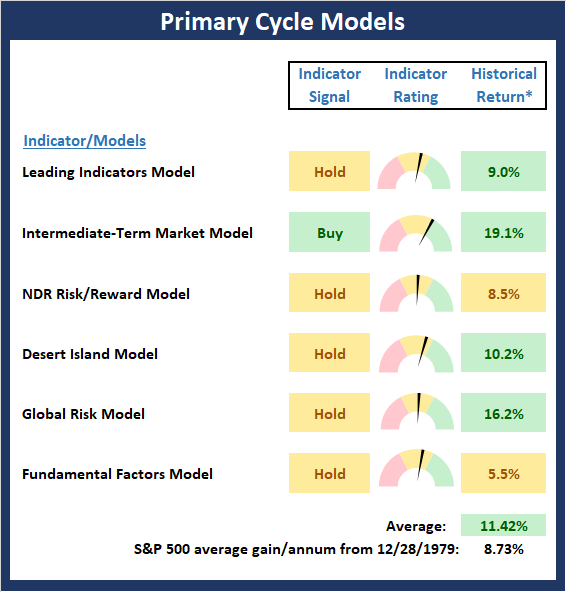
* Source: Ned Davis Research (NDR) as of the date of publication. Historical returns are hypothetical average annual performances calculated by NDR. Past performances do not guarantee future results or profitability - NOT INDIVIDUAL INVESTMENT ADVICE.
The State of the Fundamental Backdrop
Next, we review the market's fundamental factors in the areas of interest rates, the economy, inflation, and valuations.
Once again, there are no changes to the Fundamental Factors board this week. This too can be considered moderately positive.
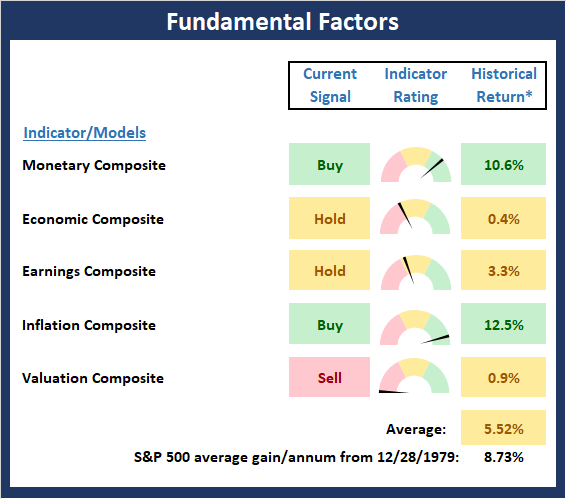
* Source: Ned Davis Research (NDR) as of the date of publication. Historical returns are hypothetical average annual performances calculated by NDR. Past performances do not guarantee future results or profitability - NOT INDIVIDUAL INVESTMENT ADVICE.
The State of the Trend
After looking at the big-picture models and the fundamental backdrop, I like to look at the state of the trend. This board of indicators is designed to tell us about the overall technical health of the current trend.
After the best run over a 50-day period in history, it isn't surprising to see an awful lot of green on the Price Trend board. In addition, our shorter-term "Trading Regime" model moved from mean reverting to trending. As such, investors should give the bulls the benefit of any doubt during the next inevitable pullback.
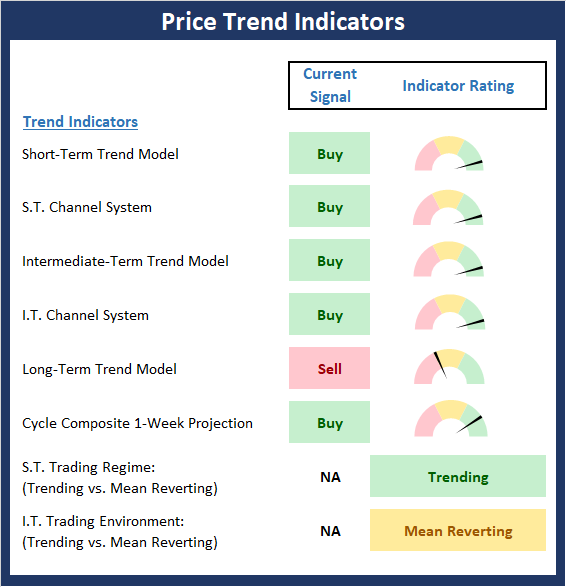
* Source: Ned Davis Research (NDR) as of the date of publication. Historical returns are hypothetical average annual performances calculated by NDR. Past performances do not guarantee future results or profitability - NOT INDIVIDUAL INVESTMENT ADVICE.
The State of Internal Momentum
Next, we analyze the "oomph" behind the current trend via our group of market momentum indicators/models.
It is also positive that the Momentum Board is almost universally green at the present time. Also note that with no fewer than three breadth thrust buy signals firing last week, the historical return of the S&P 500 given the current readings of the momentum board has jumped from 12.25% to 21.16%. The bottom line is simple, this board suggests that there is indeed some "oomph" behind the rally.
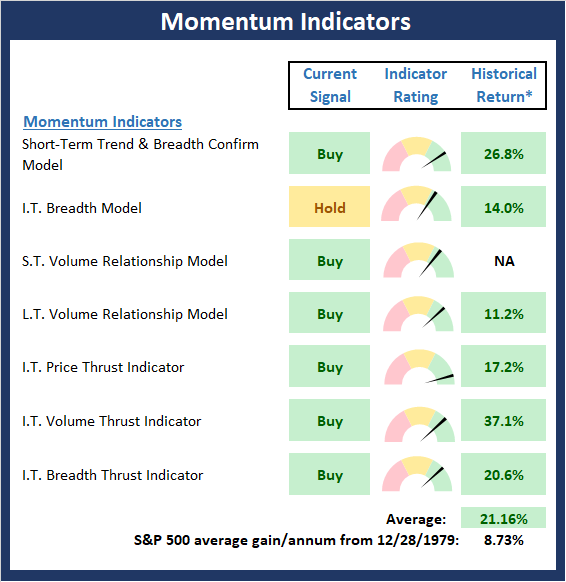
* Source: Ned Davis Research (NDR) as of the date of publication. Historical returns are hypothetical average annual performances calculated by NDR. Past performances do not guarantee future results or profitability - NOT INDIVIDUAL INVESTMENT ADVICE.
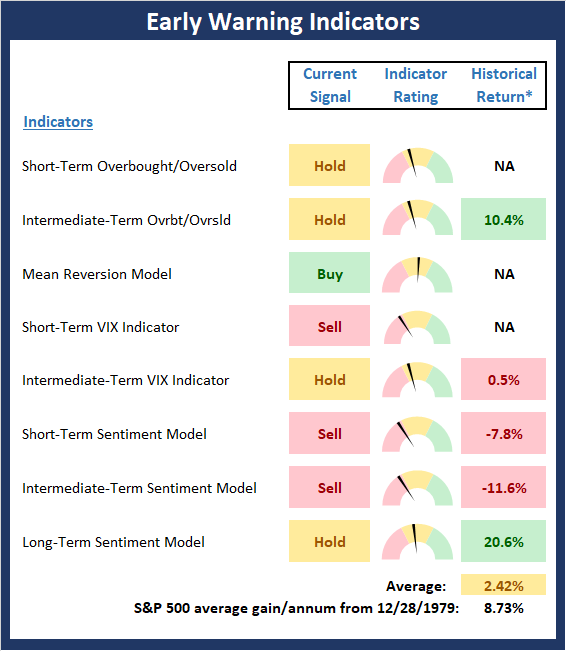
Early Warning Signals
Once we have identified the current environment, the state of the trend, and the degree of momentum behind the move, we then review the potential for a counter-trend move to begin. This batch of indicators is designed to suggest when the table is set for the trend to "go the other way."
The Early Warning board continues to favor the bears. However, it is important to keep in mind that when the bulls get on a roll, stocks can get overbought and stay overbought for extended periods of time.
* Source: Ned Davis Research (NDR) as of the date of publication. Historical returns are hypothetical average annual performances calculated by NDR. Past performances do not guarantee future results or profitability - NOT INDIVIDUAL INVESTMENT ADVICE.
Disclosure: At the time of publication, Mr. Moenning held long positions in the following securities mentioned: none - Note that positions may change at any time.
The opinions and forecasts ...
more

